
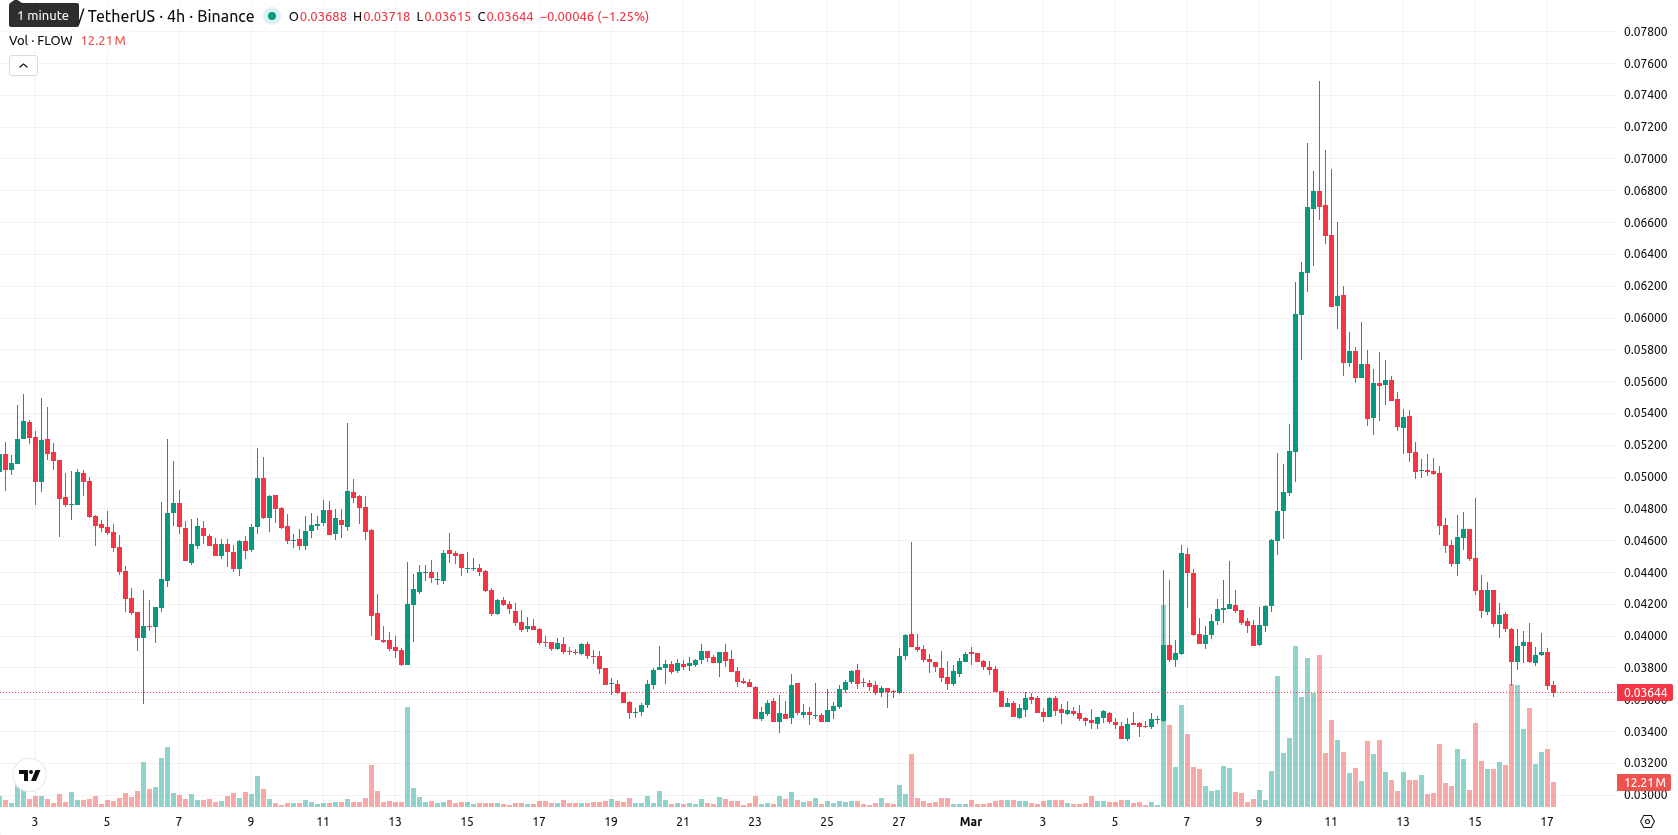
-8.98% for Flow — Sellers control market as asset stays below key averages

Flow (FLOW) is trading at $0.0365 after a daily loss of 8.98%, now sitting well below its SMA-20 ($0.0427), SMA-50 ($0.0447), and SMA-200 ($0.1990) levels. This places the asset firmly below key moving averages and reflects strong bearish pressure across short-, medium-, and long-term trends.
Highlights
- Flow was delisted from major South Korean exchanges following a court decision, fueling concerns about domestic liquidity and market access.
- The Flow foundation seeks new Asia-Pacific listings, including a potential partnership with Korbit, while emphasizing institutional adoption and long-term investment support.
- Technicals indicate persistent bearish momentum, with FLOW trading well below key averages and expected to remain pressured in the $0.0330–$0.0385 range barring a decisive breakout.
Delistings and court decision drive search for Asia-Pacific listings
Flow has been delisted from major South Korean cryptocurrency exchanges Upbit, Bithumb, and Coinone after a court upheld the decision. The Flow foundation is seeking additional exchange listings in the Asia-Pacific region and is exploring a partnership with Korbit as a potential domestic trading venue. Flow has also been positioned as a digital asset with long-term investment potential, supported by a structured development model and increasing institutional adoption.
Mixed intraday signals amid broad technical weakness for FLOW
Technical indicators for FLOW are predominantly bearish: the price remains below all critical moving averages, with the Ichimoku Kijun resistance at $0.0540 above. Daily MACD shows a strong buy signal and daily ADX suggests an ongoing bullish trend, but these indications diverge from the prevailing bearish direction signaled by weekly MACD, ADX, and RSI readings. The daily RSI is at 44 and trending downward, not at oversold levels, while Stoch RSI and CCI are neutral but show oversold conditions intraday. BBP is negative, indicating continued seller dominance, and the Awesome Oscillator is neutral.
Tight trading range expected as upside breakout odds remain low
Over the next five trading days, FLOW is likely to move between $0.0330 and $0.0385, representing a volatility band relative to current levels. A decisive move above the Kijun resistance at $0.0540 is necessary for a bullish scenario, while closing under $0.0330 would expose the asset to deeper declines. The probability of a sustained upside move is very low, and the baseline scenario points to sideways trading within the defined range.
Earlier, analysts noted that Flow was under persistent bearish momentum, with technical signals and selling pressure dominating across multiple timeframes. The latest combination of unfavorable delistings in Korea and continued technical weakness reinforces the bearish scenario, making a sustained move above the $0.0540 resistance a critical threshold for any reversal in trend.


Latest FLOW News


-
 Afghanistan
-
 Albania
-
 Algeria
-
 Angola
-
 Argentina
-
 Armenia
-
 Australia
-
 Austria
-
 Azerbaijan
-
 Bahamas
-
 Bahrain
-
 Bangladesh
-
 Belarus
-
 Belgium
-
 Bolivia
-
 Botswana
-
 Brazil
-
 Brunei
-
 Bulgaria
-
 Cambodia
-
 Cameroon
-
 Canada
-
 Chile
Chile
-
 China
China
-
 Colombia
-
 Congo
Congo
-
 Costa Rica
-
 Cote d'Ivoire
-
 Croatia
-
 Cuba
Cuba
-
 Cyprus
-
 Czechia
-
 DR Congo
-
 Denmark
-
 Dominican Republic
-
 Ecuador
-
 Egypt
Egypt
-
 El Salvador
-
 Estonia
-
 Eswatini
-
 Ethiopia
-
 Finland
-
 France
-
 Georgia
-
 Germany
-
 Ghana
Ghana
-
 Greece
-
 Haiti
Haiti
-
 Hong Kong
-
 Hungary
-
 India
India
-
 Indonesia
-
 Iran, Islamic republic
-
 Iraq
Iraq
-
 Ireland
-
 Israel
-
 Italy
Italy
-
 Jamaica
-
 Japan
Japan
-
 Jordan
-
 Kazakhstan
-
 Kenya
Kenya
-
 Korea
Korea
-
 Kuwait
-
 Kyrgyzstan
-
 Laos
Laos
-
 Latvia
-
 Lebanon
-
 Lesotho
-
 Libya
Libya
-
 Lithuania
-
 Luxembourg
-
 Madagascar
-
 Malaysia
-
 Malta
Malta
-
 Mauritius
-
 Mexico
-
 Moldova
-
 Mongolia
-
 Montenegro
-
 Morocco
-
 Mozambique
-
 Myanmar
-
 Namibia
-
 Nepal
Nepal
-
 Netherlands
-
 New Zealand
-
 Nigeria
-
 North Macedonia
-
 Norway
-
 Oman
Oman
-
 Pakistan
-
 Palestine
-
 Panama
-
 Papua New Guinea
-
 Paraguay
-
 Peru
Peru
-
 Philippines
-
 Poland
-
 Portugal
-
 Puerto Rico
-
 Qatar
Qatar
-
 Reunion
-
 Romania
-
 Rwanda
-
 Saudi Arabia
-
 Serbia
-
 Singapore
-
 Slovakia
-
 Slovenia
-
 Somalia
-
 South Africa
-
 Spain
Spain
-
 Sri Lanka
-
 Sweden
-
 Switzerland
-
 Syria
Syria
-
 Taiwan
-
 Tajikistan
-
 Tanzania
-
 Thailand
-
 Trinidad and Tobago
-
 Tunisia
-
 Turkey
-
 UAE
UAE
-
 Uganda
-
 Ukraine
-
 United Kingdom
-
United States
-
 Uruguay
-
 Uzbekistan
-
 Venezuela
-
 Vietnam
-
 Yemen
Yemen
-
 Zambia
-
 Zimbabwe
- Forex
- Crypto
