

Render slides 8.38% as daily indicators diverge and downside risk grows

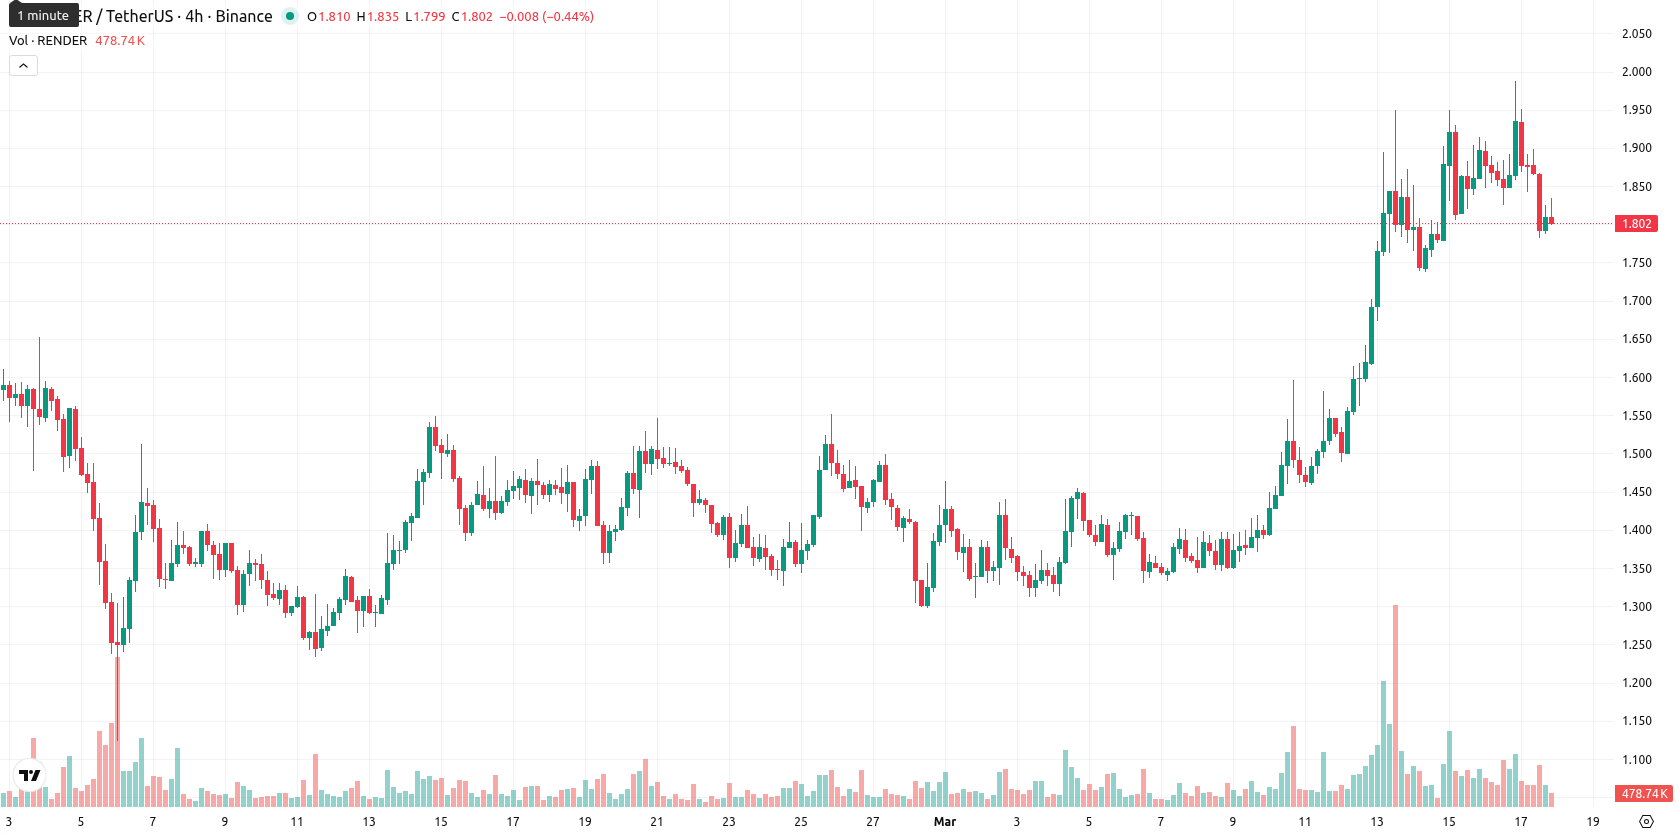
Render (RENDER) is trading at $1.805, which is above both its MA-20 ($1.5146) and MA-50 ($1.4992), indicating positive short- and medium-term momentum, but it remains below the MA-200 ($2.2014), signaling longer-term resistance persists. The Ichimoku Kijun level is $1.6430; being below the current price, it should be considered immediate support.
 1.4
1.6400
Highlights
- Render Network will migrate from Ethereum to Solana, aiming to boost scalability and decentralize governance via RNDR token holders.
- Network upgrades prioritize improved user experience and rendering security, although token price action remains under broad selling pressure.
- Despite mixed signals and high volatility, RENDER faces a projected range of $1.62–$1.98, with downside risk outweighing bullish momentum.
Governance shift and network migration amid sustained selling pressure
The foundational development of the Render Network has been closely associated with Jules Urbach, CEO of OTOY, Inc., and the project has emphasized decentralization by planning to migrate from Ethereum to Solana for improved scalability. The network's transition to a decentralized autonomous organization is expected to shift future governance to RNDR token holders. Prioritization of user experience upgrades and security enhancements for the rendering process was also cited, though price action has remained under broader selling pressure.
Diverging momentum signals as overbought readings meet heavy volatility
Momentum signals on the daily chart are mixed: the MACD and ADX suggest ongoing bullish strength, while the RSI at 76.13 and CCI at 179.43 indicate overbought conditions and a potential for a pullback. The Stoch RSI also flags an overbought market, whereas BBP points to continued buyer dominance on the session. The AO aligns with the general upward trend, but today's drop—down 8.38% to $1.805 after a minor gap at the open—puts the price near the lower end of the daily trading range ($1.782–$1.951), reflecting high volatility and notable intraday pressure. This sharp decline stands in contrast to some still-bullish momentum signals, highlighting divergence between trending and oscillating indicators.
Downside favored as technical consensus drives low upside odds
For the next five trading days, the expected range is adjusted to $1.62 – $1.98, capturing typical weekly volatility around the current price. Based on the weekly combination of RSI, ADX, MACD, and MA-50 (all signaling "Sell"), the probability of further price increases is very low (less than 20%), making further declines much more likely. Baseline scenario: RENDER trades sideways between $1.62 and $1.98. Bullish scenario: a break above immediate resistance at $1.98 would open a path to short-term recovery. Bearish scenario: a drop below $1.62 would signal a deeper correction, with sellers regaining control.
Earlier, analysts noted that Render’s long-term outlook depends on its ability to secure a significant position within the growing decentralized computing space, driven by demand for GPU infrastructure. The current price action, amid ongoing volatility and a prevailing downside bias, underscores the importance of monitoring the $1.62 support—where a breakdown could trigger further losses in the near term.









-
 Afghanistan
-
 Albania
-
 Algeria
-
 Angola
-
 Argentina
-
 Armenia
-
 Australia
-
 Austria
-
 Azerbaijan
-
 Bahamas
-
 Bahrain
-
 Bangladesh
-
 Belarus
-
 Belgium
-
 Bolivia
-
 Botswana
-
 Brazil
-
 Brunei
-
 Bulgaria
-
 Cambodia
-
 Cameroon
-
 Canada
-
 Chile
-
 China
-
 Colombia
-
 Congo
-
 Costa Rica
-
 Cote d'Ivoire
-
 Croatia
-
 Cuba
-
 Cyprus
-
 Czechia
-
 DR Congo
-
 Denmark
-
 Dominican Republic
-
 Ecuador
-
 Egypt
-
 El Salvador
-
 Estonia
-
 Eswatini
-
 Ethiopia
-
 Finland
-
 France
-
 Georgia
-
 Germany
-
 Ghana
-
 Greece
-
 Haiti
-
 Hong Kong
-
 Hungary
-
 India
-
 Indonesia
-
 Iran, Islamic republic
-
 Iraq
-
 Ireland
-
 Israel
-
 Italy
-
 Jamaica
-
 Japan
-
 Jordan
-
 Kazakhstan
-
 Kenya
-
 Korea
-
 Kuwait
-
 Kyrgyzstan
-
 Laos
-
 Latvia
-
 Lebanon
-
 Lesotho
-
 Libya
-
 Lithuania
-
 Luxembourg
-
 Madagascar
-
 Malaysia
-
 Malta
-
 Mauritius
-
 Mexico
-
 Moldova
-
 Mongolia
-
 Montenegro
-
 Morocco
-
 Mozambique
-
 Myanmar
-
 Namibia
-
 Nepal
-
 Netherlands
-
 New Zealand
-
 Nigeria
-
 North Macedonia
-
 Norway
-
 Oman
-
 Pakistan
-
 Palestine
-
 Panama
-
 Papua New Guinea
-
 Paraguay
-
 Peru
-
 Philippines
-
 Poland
-
 Portugal
-
 Puerto Rico
-
 Qatar
-
 Reunion
-
 Romania
-
 Rwanda
-
 Saudi Arabia
-
 Serbia
-
 Singapore
-
 Slovakia
-
 Slovenia
-
 Somalia
-
 South Africa
-
 Spain
-
 Sri Lanka
-
 Sweden
-
 Switzerland
-
 Syria
-
 Taiwan
-
 Tajikistan
-
 Tanzania
-
 Thailand
-
 Trinidad and Tobago
-
 Tunisia
-
 Turkey
-
 UAE
-
 Uganda
-
 Ukraine
-
 United Kingdom
-
United States
-
 Uruguay
-
 Uzbekistan
-
 Venezuela
-
 Vietnam
-
 Yemen
-
 Zambia
-
 Zimbabwe
- Forex
- Crypto












