
Ethereum price prediction: Will ETF outflows trigger deeper losses? ETH down 1.91%

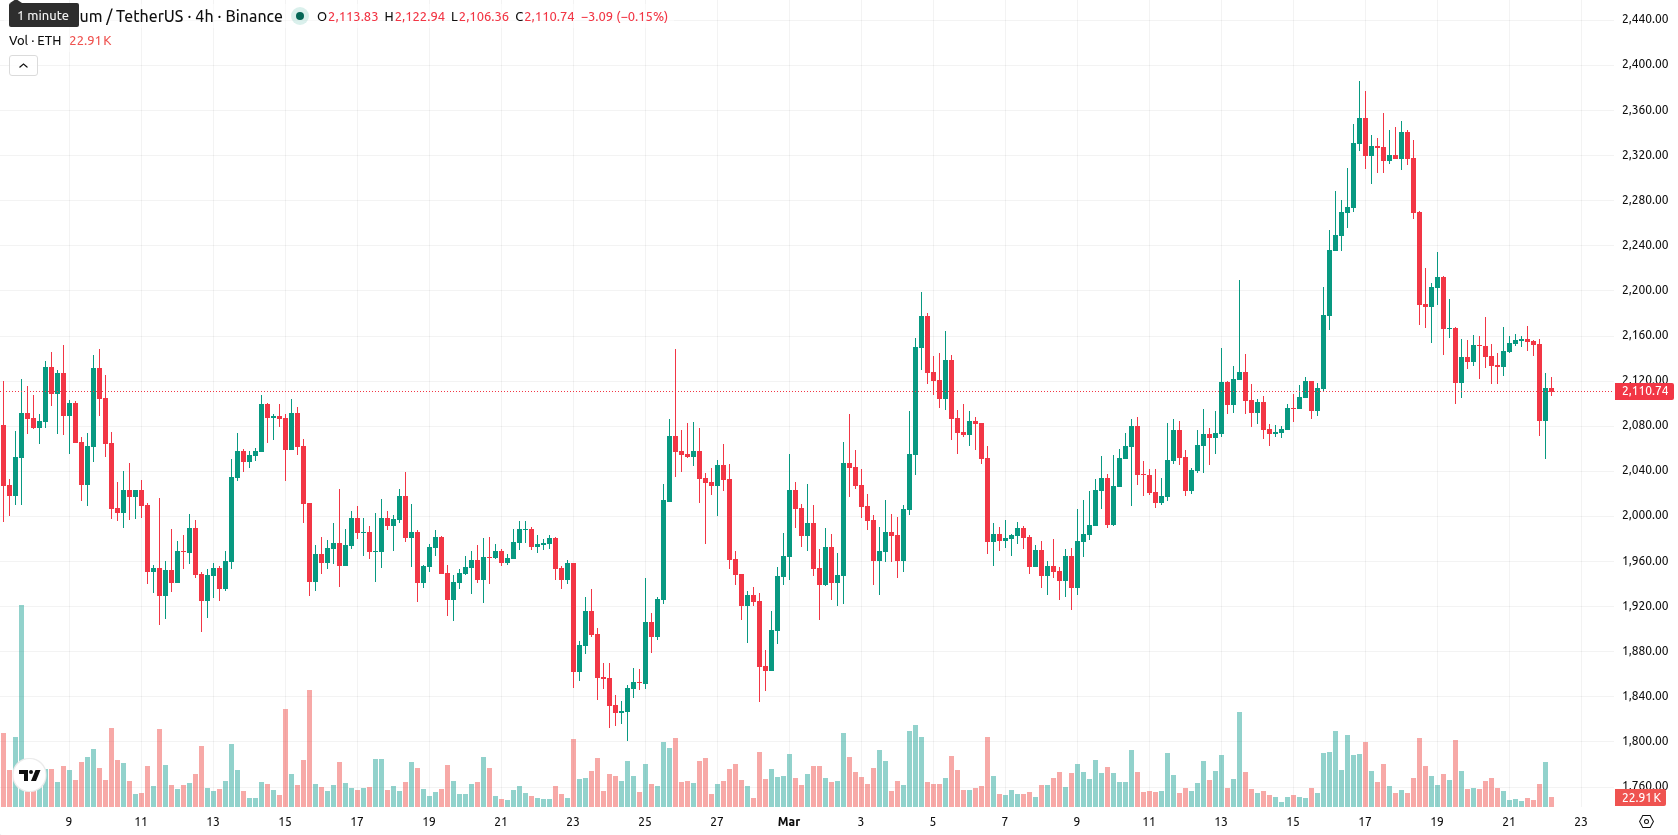
Ethereum (ETH) is currently trading at $2,111.39, placing it just above the SMA-20 ($2,096.01) and SMA-50 ($2,059.59), but well below the longer-term SMA-200 ($3,171.75), suggesting short- and medium-term support but continued long-term bearish pressure. The Ichimoku Kijun on D1 stands at $2,093.01, which now acts as immediate support beneath the market.
Highlights
- Ethereum-focused ETFs saw $131.2 million in outflows, led by BlackRock's $102 million sell-off, indicating heavy institutional selling pressure.
- Despite outflows, active Ethereum wallet addresses more than doubled in four days, with evidence of significant whale accumulation at present price levels.
- Technical signals are mixed with short- and medium-term support, but ETH remains under prevailing bearish trend, likely staying within a $2,010–$2,130 trading range next week.
ETF outflows and whale accumulation drive heightened activity amid pressure
Significant ETF outflows shaped the Ethereum market environment on March 21, with approximately $131.2 million withdrawn from ETH-focused exchange traded funds and BlackRock accounting for over $102 million in selling. BlackRock’s iShares Staked Ethereum Trust (ETHB), launched on March 12, has quickly accumulated around $254 million in assets under management, including $146 million in net inflows and a $100 million seed investment. Increased address activity was also observed, as the number of active Ethereum wallets rose sharply from 381,202 to 841,404 over a four-day period, accompanied by reports of whale accumulation at current levels, though price action has remained under broader selling pressure.
Bullish bias weakens as momentum indicators reflect mixed signals
Momentum signals remain mixed for ETH. The MACD and ADX on the daily chart point to a mild bullish bias, but daily oscillators are less decisive, with an RSI of 51.78 suggesting a slight buy signal, while Stoch RSI and CCI stay neutral. The Bull/Bear Power (BBP) indicator is classified as overbought, indicating recent buyer dominance but also the possibility of exhaustion. Price currently sits toward the upper end of the daily range ($2,056.50 — $2,126.58) and is showing only modest confirmation from momentum, with no strong signal from the Awesome Oscillator.
Sideways price outlook as persistent sell signals cap breakout risk
For the coming week, ETH is expected to fluctuate within a typical volatility band of $2,010 to $2,130. The baseline scenario sees ETH moving sideways, bounded by immediate support at $2,093 and resistance near $2,130. Should a bullish breakout above $2,130 occur, prices could move toward $2,150, but this has a low probability given persistent daily and weekly sell signals. A bearish move below $2,010 risks further declines toward the $2,000 area, consistent with prevailing momentum.
In a recent review, analysts concluded that Ethereum's technical setup reflected ongoing support amid persistent long-term bearish pressures. With fresh evidence of intensified ETF outflows and rising on-chain activity, traders should closely monitor the $2,130 resistance and $2,010 support as potential triggers for Ethereum's next significant move.


Latest Ethereum News


-
 Afghanistan
-
 Albania
-
 Algeria
-
 Angola
-
 Argentina
-
 Armenia
-
 Australia
-
 Austria
-
 Azerbaijan
-
 Bahamas
-
 Bahrain
-
 Bangladesh
-
 Belarus
-
 Belgium
-
 Bolivia
-
 Botswana
-
 Brazil
-
 Brunei
-
 Bulgaria
-
 Cambodia
-
 Cameroon
-
 Canada
-
 Chile
Chile
-
 China
China
-
 Colombia
-
 Congo
Congo
-
 Costa Rica
-
 Cote d'Ivoire
-
 Croatia
-
 Cuba
Cuba
-
 Cyprus
-
 Czechia
-
 DR Congo
-
 Denmark
-
 Dominican Republic
-
 Ecuador
-
 Egypt
Egypt
-
 El Salvador
-
 Estonia
-
 Eswatini
-
 Ethiopia
-
 Finland
-
 France
-
 Georgia
-
 Germany
-
 Ghana
Ghana
-
 Greece
-
 Haiti
Haiti
-
 Hong Kong
-
 Hungary
-
 India
India
-
 Indonesia
-
 Iran, Islamic republic
-
 Iraq
Iraq
-
 Ireland
-
 Israel
-
 Italy
Italy
-
 Jamaica
-
 Japan
Japan
-
 Jordan
-
 Kazakhstan
-
 Kenya
Kenya
-
 Korea
Korea
-
 Kuwait
-
 Kyrgyzstan
-
 Laos
Laos
-
 Latvia
-
 Lebanon
-
 Lesotho
-
 Libya
Libya
-
 Lithuania
-
 Luxembourg
-
 Madagascar
-
 Malaysia
-
 Malta
Malta
-
 Mauritius
-
 Mexico
-
 Moldova
-
 Mongolia
-
 Montenegro
-
 Morocco
-
 Mozambique
-
 Myanmar
-
 Namibia
-
 Nepal
Nepal
-
 Netherlands
-
 New Zealand
-
 Nigeria
-
 North Macedonia
-
 Norway
-
 Oman
Oman
-
 Pakistan
-
 Palestine
-
 Panama
-
 Papua New Guinea
-
 Paraguay
-
 Peru
Peru
-
 Philippines
-
 Poland
-
 Portugal
-
 Puerto Rico
-
 Qatar
Qatar
-
 Reunion
-
 Romania
-
 Rwanda
-
 Saudi Arabia
-
 Serbia
-
 Singapore
-
 Slovakia
-
 Slovenia
-
 Somalia
-
 South Africa
-
 Spain
Spain
-
 Sri Lanka
-
 Sweden
-
 Switzerland
-
 Syria
Syria
-
 Taiwan
-
 Tajikistan
-
 Tanzania
-
 Thailand
-
 Trinidad and Tobago
-
 Tunisia
-
 Turkey
-
 UAE
UAE
-
 Uganda
-
 Ukraine
-
 United Kingdom
-
United States
-
 Uruguay
-
 Uzbekistan
-
 Venezuela
-
 Vietnam
-
 Yemen
Yemen
-
 Zambia
-
 Zimbabwe
- Forex
- Crypto
