
-1.97% for Ethereum as $98 million in liquidations hit after Fed decision

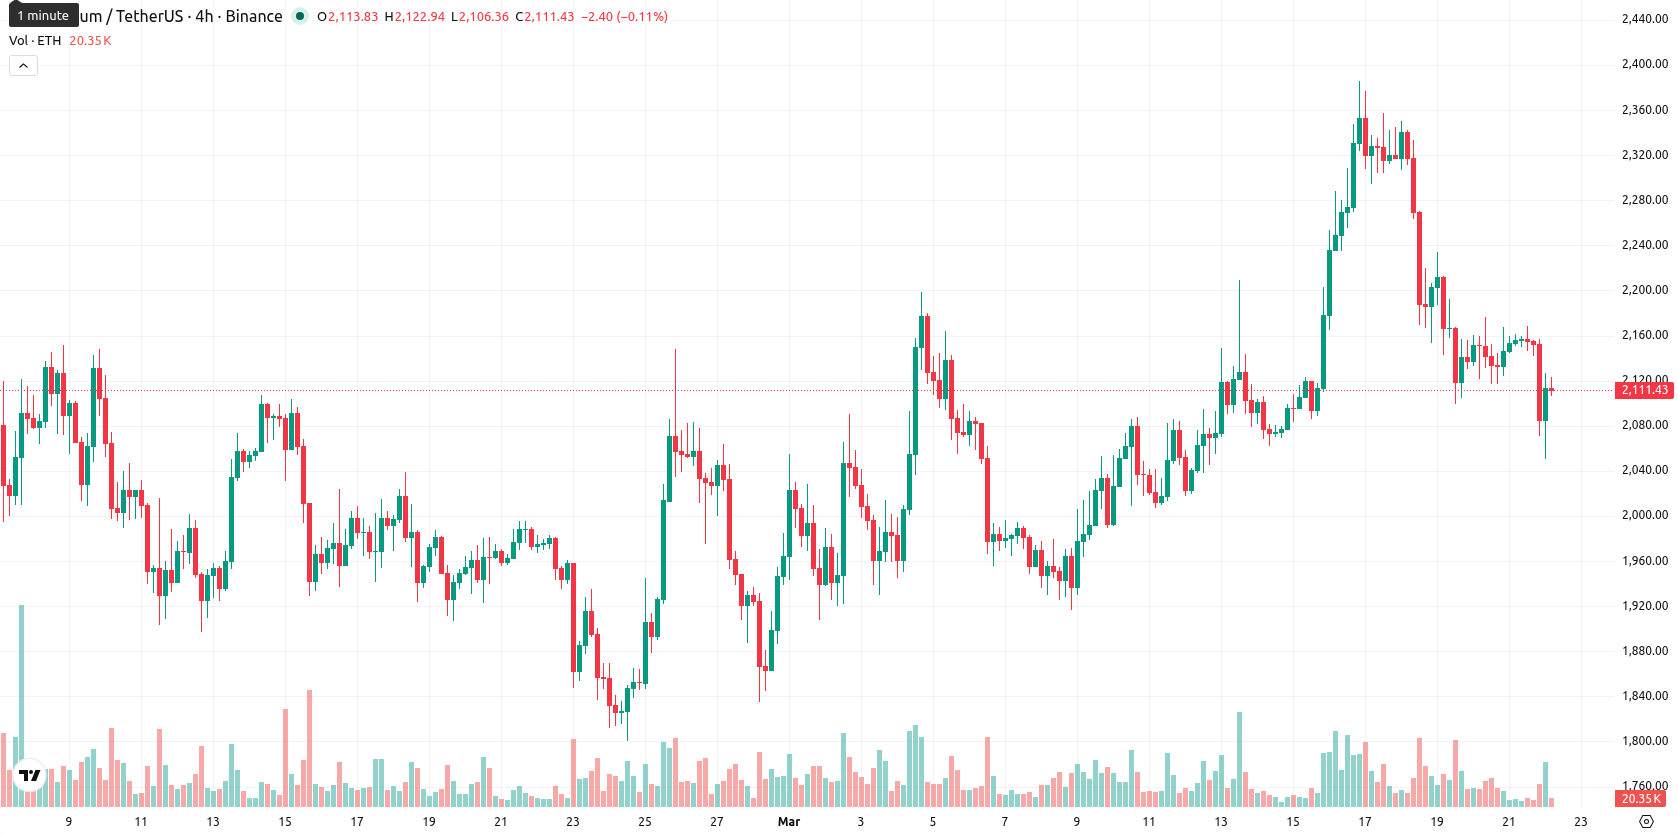
Ethereum (ETH) is trading at $2,111.12, down 1.97% for the day and currently positioned above both the SMA-20 at $2,096.01 and the SMA-50 at $2,059.59, though it remains well below the SMA-200 at $3,171.75. This technical positioning suggests that short- and medium-term trends offer some support, but longer-term pressures persist.
Highlights
- US spot Ethereum ETFs saw $234 million in net outflows over three sessions, signaling a sharp drop in institutional demand.
- The Federal Reserve's hawkish stance and higher 2026 inflation outlook lifted risk premiums for crypto, triggering $98 million in Ethereum liquidations.
- Technical indicators point to weak buyer momentum and likely downside, with Ethereum expected to consolidate between $2,010 and $2,128 over the next week.
Institutional outflows and policy shifts drive heightened crypto risk
US spot Ethereum ETFs recorded net outflows over three consecutive sessions, with $234 million withdrawn as of March 20, which reduced dollar-based institutional demand. The Federal Reserve maintained interest rates at 3.5% to 3.75% and raised its 2026 inflation outlook, leading to increased risk premiums for crypto and resulting in $98 million in Ethereum liquidations. Regulatory progress in the EU continued with BaFin’s MiCA implementation and Swiss FINMA-compliant staked ETH ETPs, providing greater clarity for Ethereum instruments, while in the US, the GENIUS Act allowed staking-focused crypto ETFs, altering the compliance environment for institutional yield products.
Mixed momentum and range-bound action as resistance caps gains
From a technical analysis perspective, ETH maintains short- and medium-term support above the SMA-20 and SMA-50, while the SMA-200 acts as a longer-term bearish threshold. The $2,093.01 Ichimoku (Kijun) level serves as immediate support, and ETH is trading within a range between today's low of $2,056.50 and high of $2,126.58. Momentum indicators are mixed: MACD suggests a mild buying bias and ADX reads 22.6, but oscillators such as RSI (51.78), Stoch RSI (neutral), and CCI (near zero) point to subdued momentum. BBP remains elevated and intraday moves lack consistency, with AO directionally neutral.
Sideways consolidation expected as upside breakout odds stay low
Over the next five trading days, ETH is expected to fluctuate within a typical volatility band between $2,010 and $2,128. The probability of a decisive upward breakout remains low–less than 20%, as only the MACD among weekly signals points to buy. The baseline scenario is a continued sideways consolidation in this band, while a break above $2,128 would bring the next resistance into play, though short-term signals offer little backing for this scenario. A decline below $2,010 could prompt increased selling, as longer-term moving averages continue to exert downward pressure.
Earlier, analysts noted that large whales and select institutions were strategically accumulating Ethereum despite broader market weakness and ETF outflows. With ongoing regulatory developments and evolving technical patterns, traders should monitor for a breakout beyond $2,128 or a breakdown below $2,010 as signals of the next directional move.


-
 Afghanistan
-
 Albania
-
 Algeria
-
 Angola
-
 Argentina
-
 Armenia
-
 Australia
-
 Austria
-
 Azerbaijan
-
 Bahamas
-
 Bahrain
-
 Bangladesh
-
 Belarus
-
 Belgium
-
 Bolivia
-
 Botswana
-
 Brazil
-
 Brunei
-
 Bulgaria
-
 Cambodia
-
 Cameroon
-
 Canada
-
 Chile
Chile
-
 China
China
-
 Colombia
-
 Congo
Congo
-
 Costa Rica
-
 Cote d'Ivoire
-
 Croatia
-
 Cuba
Cuba
-
 Cyprus
-
 Czechia
-
 DR Congo
-
 Denmark
-
 Dominican Republic
-
 Ecuador
-
 Egypt
Egypt
-
 El Salvador
-
 Estonia
-
 Eswatini
-
 Ethiopia
-
 Finland
-
 France
-
 Georgia
-
 Germany
-
 Ghana
Ghana
-
 Greece
-
 Haiti
Haiti
-
 Hong Kong
-
 Hungary
-
 India
India
-
 Indonesia
-
 Iran, Islamic republic
-
 Iraq
Iraq
-
 Ireland
-
 Israel
-
 Italy
Italy
-
 Jamaica
-
 Japan
Japan
-
 Jordan
-
 Kazakhstan
-
 Kenya
Kenya
-
 Korea
Korea
-
 Kuwait
-
 Kyrgyzstan
-
 Laos
Laos
-
 Latvia
-
 Lebanon
-
 Lesotho
-
 Libya
Libya
-
 Lithuania
-
 Luxembourg
-
 Madagascar
-
 Malaysia
-
 Malta
Malta
-
 Mauritius
-
 Mexico
-
 Moldova
-
 Mongolia
-
 Montenegro
-
 Morocco
-
 Mozambique
-
 Myanmar
-
 Namibia
-
 Nepal
Nepal
-
 Netherlands
-
 New Zealand
-
 Nigeria
-
 North Macedonia
-
 Norway
-
 Oman
Oman
-
 Pakistan
-
 Palestine
-
 Panama
-
 Papua New Guinea
-
 Paraguay
-
 Peru
Peru
-
 Philippines
-
 Poland
-
 Portugal
-
 Puerto Rico
-
 Qatar
Qatar
-
 Reunion
-
 Romania
-
 Rwanda
-
 Saudi Arabia
-
 Serbia
-
 Singapore
-
 Slovakia
-
 Slovenia
-
 Somalia
-
 South Africa
-
 Spain
Spain
-
 Sri Lanka
-
 Sweden
-
 Switzerland
-
 Syria
Syria
-
 Taiwan
-
 Tajikistan
-
 Tanzania
-
 Thailand
-
 Trinidad and Tobago
-
 Tunisia
-
 Turkey
-
 UAE
UAE
-
 Uganda
-
 Ukraine
-
 United Kingdom
-
United States
-
 Uruguay
-
 Uzbekistan
-
 Venezuela
-
 Vietnam
-
 Yemen
Yemen
-
 Zambia
-
 Zimbabwe
- Forex
- Crypto
