
Ethereum price prediction: Will $1,655.07–$1,759.26 range hold as ETH trades flat?

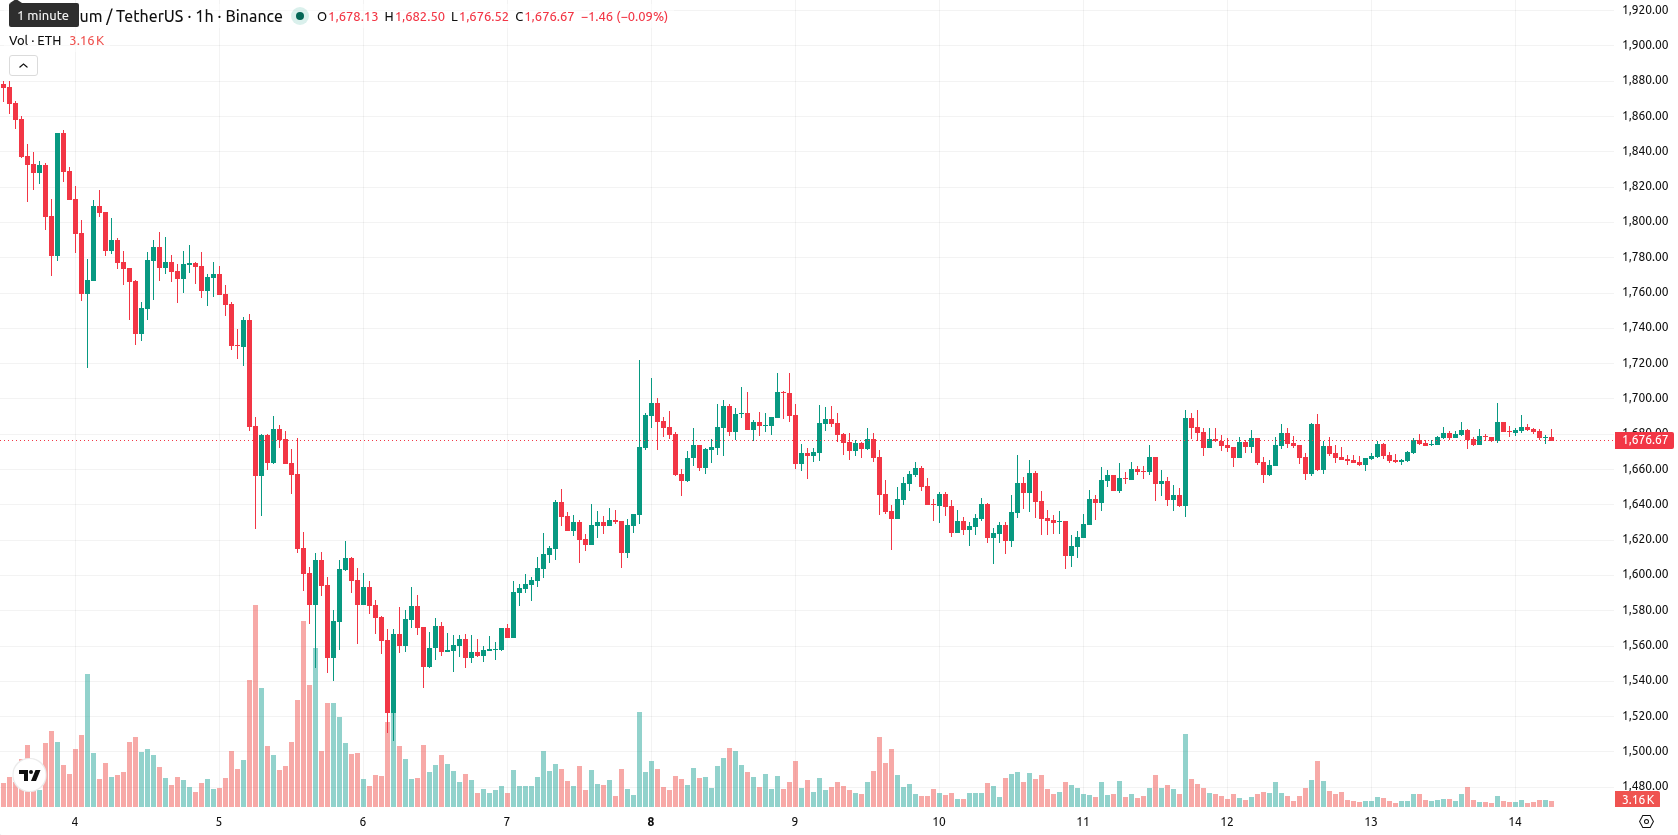
Ethereum (ETH) is trading at $1,679.90, up 0.83% on the day after opening with a small gap higher. The price currently trades above its key short- and medium-term moving averages, indicating ongoing recovery momentum.
Highlights
- The SEC's approval for NYSE Arca to list T. Rowe Price Active Crypto ETF, including Ethereum, signals expanding regulated institutional access and could drive ETH demand.
- Market liquidity briefly tightened following $24.65 million in liquidations and large holder outflows, but institutional positioning remains dynamic as ETF flows shift with a recent $82 million net inflow led by Fidelity.
- ETH/USD displays mixed momentum, with short- and medium-term technical strength but long-term bearish bias; expected to consolidate between $1,655.07 and $1,759.26 over the next 2–3 days amid directional indecision.
ETF listing fuels institutional demand as liquidity constraints emerge
The U.S. Securities and Exchange Commission's approval of NYSE Arca's proposal to list and trade the T. Rowe Price Active Crypto ETF, which includes Ethereum, marks a significant step in broadening regulated access for institutional investors and could increase demand for ETH. This development follows $24.65 million in liquidations and notable outflows from major holders, temporarily reducing market liquidity as investors repositioned amid pressured conditions. Meanwhile, ETF flows remain mixed, with four consecutive days of $4.95 million in net outflows offset by a recent $82 million net inflow led by Fidelity's FETH product, highlighting shifting institutional activity.
Mixed momentum signals amid mid-range trade and support at Kijun
ETH/USD is trading above the MA-20 and MA-50 on the 1-hour chart, while still well below the daily MA-200. The Ichimoku Kijun level at $1,679.74 acts as immediate support. Momentum signals present a mixed picture: MACD is at Strong Buy and ADX at Buy, indicating underlying upward potential, but CCI registers a Sell and BBP points to oversold seller dominance intraday. RSI and Stoch RSI both flag oversold conditions, and the Awesome Oscillator remains neutral, underscoring market indecision within a low-volatility, mid-range setup.
Sideways bias holds as breakout odds favor resistance challenge
Over the next 2 to 3 trading days, ETH/USD is expected to consolidate within a range of $1,655.07 to $1,759.26. The probability of an upward breakout is estimated at 57%, while the downside scenario remains less likely. The baseline expectation is for sideways movement within this volatility band; a break above range resistance could see the price approach the upper boundary, while a decisive move below immediate support would suggest further weakness.
Previously it was reported that Ethereum faced persistent fund outflows and mixed technical signals, leading to cautious optimism for a potential shift in market sentiment. With institutional access broadening through ETF approvals and recent intraday signals pointing to market indecision, traders should monitor for a breakout above $1,759.26 or a decisive drop below $1,679.74 to gauge the next directional move.


-
 Afghanistan
-
 Albania
-
 Algeria
-
 Angola
-
 Argentina
-
 Armenia
-
 Australia
-
 Austria
-
 Azerbaijan
-
 Bahamas
-
 Bahrain
-
 Bangladesh
-
 Belarus
-
 Belgium
-
 Bolivia
-
 Botswana
-
 Brazil
-
 Brunei
-
 Bulgaria
-
 Cambodia
-
 Cameroon
-
 Canada
-
 Chile
Chile
-
 China
China
-
 Colombia
-
 Congo
Congo
-
 Costa Rica
-
 Cote d'Ivoire
-
 Croatia
-
 Cuba
Cuba
-
 Cyprus
-
 Czechia
-
 DR Congo
-
 Denmark
-
 Dominican Republic
-
 Ecuador
-
 Egypt
Egypt
-
 El Salvador
-
 Estonia
-
 Eswatini
-
 Ethiopia
-
 Finland
-
 France
-
 Georgia
-
 Germany
-
 Ghana
Ghana
-
 Greece
-
 Haiti
Haiti
-
 Hong Kong
-
 Hungary
-
 India
India
-
 Indonesia
-
 Iran, Islamic republic
-
 Iraq
Iraq
-
 Ireland
-
 Israel
-
 Italy
Italy
-
 Jamaica
-
 Japan
Japan
-
 Jordan
-
 Kazakhstan
-
 Kenya
Kenya
-
 Korea
Korea
-
 Kuwait
-
 Kyrgyzstan
-
 Laos
Laos
-
 Latvia
-
 Lebanon
-
 Lesotho
-
 Libya
Libya
-
 Lithuania
-
 Luxembourg
-
 Madagascar
-
 Malaysia
-
 Malta
Malta
-
 Mauritius
-
 Mexico
-
 Moldova
-
 Mongolia
-
 Montenegro
-
 Morocco
-
 Mozambique
-
 Myanmar
-
 Namibia
-
 Nepal
Nepal
-
 Netherlands
-
 New Zealand
-
 Nigeria
-
 North Macedonia
-
 Norway
-
 Oman
Oman
-
 Pakistan
-
 Palestine
-
 Panama
-
 Papua New Guinea
-
 Paraguay
-
 Peru
Peru
-
 Philippines
-
 Poland
-
 Portugal
-
 Puerto Rico
-
 Qatar
Qatar
-
 Reunion
-
 Romania
-
 Rwanda
-
 Saudi Arabia
-
 Serbia
-
 Singapore
-
 Slovakia
-
 Slovenia
-
 Somalia
-
 South Africa
-
 Spain
Spain
-
 Sri Lanka
-
 Sweden
-
 Switzerland
-
 Syria
Syria
-
 Taiwan
-
 Tajikistan
-
 Tanzania
-
 Thailand
-
 Trinidad and Tobago
-
 Tunisia
-
 Turkey
-
 UAE
UAE
-
 Uganda
-
 Ukraine
-
 United Kingdom
-
United States
-
 Uruguay
-
 Uzbekistan
-
 Venezuela
-
 Vietnam
-
 Yemen
Yemen
-
 Zambia
-
 Zimbabwe
- Forex
- Crypto
