
Quant: Fading short-term bullishness leads sharp daily decline

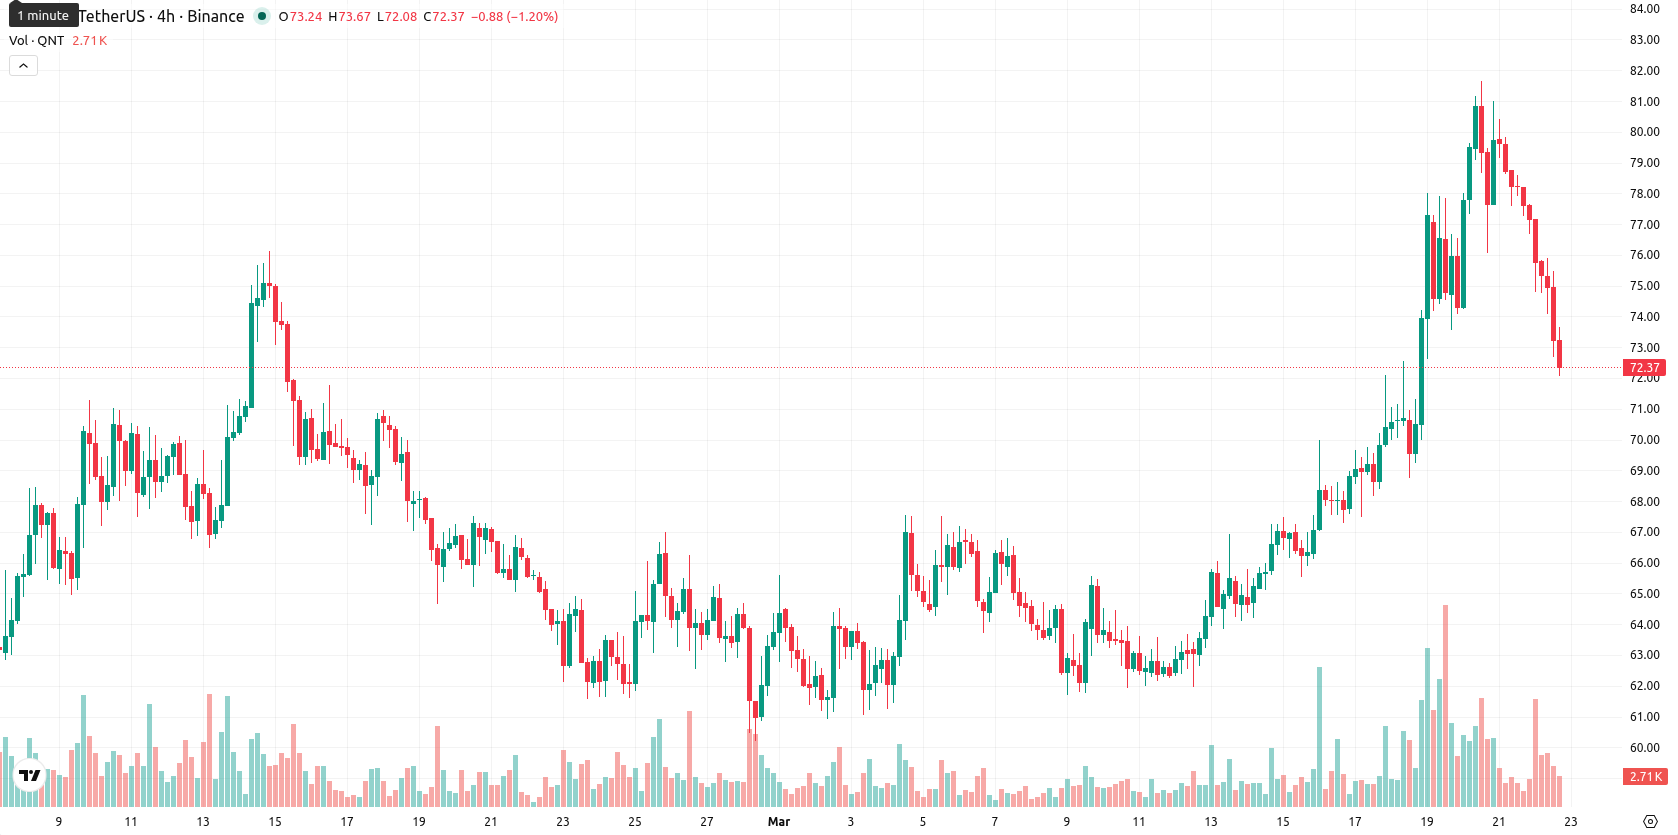
Quant (QNT) is trading at $72.11, down 7.17% for the day. The price remains above the SMA-20 ($67.32) and SMA-50 ($66.93), confirming short- and medium-term bullishness, though it continues to face long-term resistance below the SMA-200 ($80.94).
Highlights
- Quant rebounded sharply from the $55–$60 demand area, advancing to test the $80–$88 resistance zone amid strong gains.
- Despite recent upward movement, persistent broad selling pressure keeps key resistance levels at $88, $105, and $135 in focus.
- Technical signals indicate near-term overbought conditions and subdued trend strength, with QNT expected to consolidate between $68.90 and $75.30 in the coming days.
Broad seller pressure despite gains from long-term demand rebound
Quant rebounded from a long-term demand area at $55–$60 and entered the $80–$88 resistance zone after recent gains. The asset also posted a notable increase from $60.92 to $80.72 within two weeks in March. Key resistance levels were identified at $88, $105, and $135, though price action has remained under broader selling pressure.
Divergent momentum as mixed indicators meet overbought signals
Technically, QNT's current price sits above the SMA-20 and SMA-50, indicating a bullish posture in the short and medium term, but remains well below the SMA-200, highlighting unresolved long-term resistance. The Ichimoku Kijun at $70.92 acts as immediate support. Indicators are mixed: MACD gives a buy signal, but a weak ADX (18.49) shows lack of strong trend, and several oscillators (Stoch RSI, CCI, RSI at 69.1) show overbought conditions. Bull/Bear Power remains with buyers intraday, though a sharp daily drop has reversed momentum. The price is near the session lows, reflecting volatility and pressure since open, while the Awesome Oscillator supports this trend but diverges from overbought signals.
Downside risk rises as indicator consensus favors lower range
In the next five trading days, QNT is likely to fluctuate in a volatility band between $68.90 and $75.30. Sideways action is the baseline scenario, but a move above resistance could occur if buying interest strengthens. Conversely, if support at $68.90 fails, further declines may accelerate. On the weekly chart, indicator consensus points to a downside bias with a very low probability of sustained gains.
Earlier, analysts noted that Quant's bullish momentum was tempered by persistent resistance and mixed technical signals on higher timeframes. The current analysis adds to this view by highlighting increased volatility and downside risk, with traders advised to monitor the $68.90 support as a key threshold for near-term direction.


-
 Afghanistan
-
 Albania
-
 Algeria
-
 Angola
-
 Argentina
-
 Armenia
-
 Australia
-
 Austria
-
 Azerbaijan
-
 Bahamas
-
 Bahrain
-
 Bangladesh
-
 Belarus
-
 Belgium
-
 Bolivia
-
 Botswana
-
 Brazil
-
 Brunei
-
 Bulgaria
-
 Cambodia
-
 Cameroon
-
 Canada
-
 Chile
Chile
-
 China
China
-
 Colombia
-
 Congo
Congo
-
 Costa Rica
-
 Cote d'Ivoire
-
 Croatia
-
 Cuba
Cuba
-
 Cyprus
-
 Czechia
-
 DR Congo
-
 Denmark
-
 Dominican Republic
-
 Ecuador
-
 Egypt
Egypt
-
 El Salvador
-
 Estonia
-
 Eswatini
-
 Ethiopia
-
 Finland
-
 France
-
 Georgia
-
 Germany
-
 Ghana
Ghana
-
 Greece
-
 Haiti
Haiti
-
 Hong Kong
-
 Hungary
-
 India
India
-
 Indonesia
-
 Iran, Islamic republic
-
 Iraq
Iraq
-
 Ireland
-
 Israel
-
 Italy
Italy
-
 Jamaica
-
 Japan
Japan
-
 Jordan
-
 Kazakhstan
-
 Kenya
Kenya
-
 Korea
Korea
-
 Kuwait
-
 Kyrgyzstan
-
 Laos
Laos
-
 Latvia
-
 Lebanon
-
 Lesotho
-
 Libya
Libya
-
 Lithuania
-
 Luxembourg
-
 Madagascar
-
 Malaysia
-
 Malta
Malta
-
 Mauritius
-
 Mexico
-
 Moldova
-
 Mongolia
-
 Montenegro
-
 Morocco
-
 Mozambique
-
 Myanmar
-
 Namibia
-
 Nepal
Nepal
-
 Netherlands
-
 New Zealand
-
 Nigeria
-
 North Macedonia
-
 Norway
-
 Oman
Oman
-
 Pakistan
-
 Palestine
-
 Panama
-
 Papua New Guinea
-
 Paraguay
-
 Peru
Peru
-
 Philippines
-
 Poland
-
 Portugal
-
 Puerto Rico
-
 Qatar
Qatar
-
 Reunion
-
 Romania
-
 Rwanda
-
 Saudi Arabia
-
 Serbia
-
 Singapore
-
 Slovakia
-
 Slovenia
-
 Somalia
-
 South Africa
-
 Spain
Spain
-
 Sri Lanka
-
 Sweden
-
 Switzerland
-
 Syria
Syria
-
 Taiwan
-
 Tajikistan
-
 Tanzania
-
 Thailand
-
 Trinidad and Tobago
-
 Tunisia
-
 Turkey
-
 UAE
UAE
-
 Uganda
-
 Ukraine
-
 United Kingdom
-
United States
-
 Uruguay
-
 Uzbekistan
-
 Venezuela
-
 Vietnam
-
 Yemen
Yemen
-
 Zambia
-
 Zimbabwe
- Forex
- Crypto
