
Ethereum price prediction: Sideways action ahead as ETH faces seller pressure near $2,000

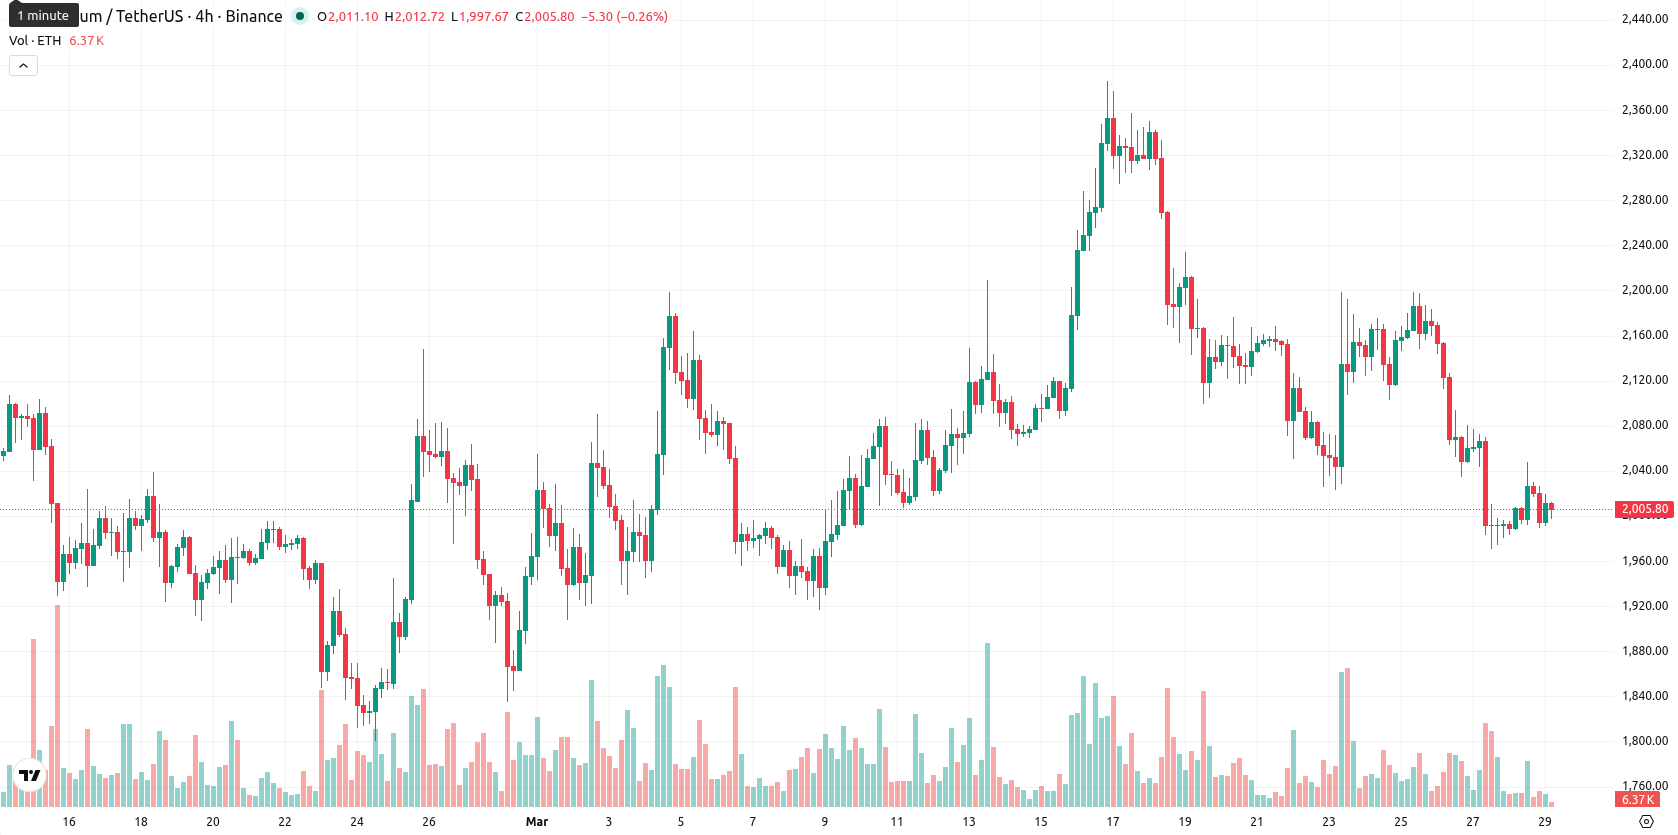
Ethereum (ETH) is trading at $2,005, up 0.04% on the day and holding near the midpoint of today's $1,991.95 – $2,017.13 range. ETH remains below its key short-, mid-, and long-term moving averages: the SMA-20 at $2,117.35, SMA-50 at $2,043.21, and SMA-200 at $3,093.10, signaling continued seller pressure across all timeframes.
Highlights
- Ethereum saw over $110 million in long liquidations as the Foundation moved forward with post-quantum security upgrades.
- Development activity led by Ethereum ecosystem projects increased, signaling continued commitment to innovation and network security.
- ETH trades below all key moving averages with oversold momentum indicators, indicating likely sideways to lower price action between $1,900–$2,110 over the next week.
Long liquidations surge amid post-quantum upgrade focus and ecosystem activity
On March 28, 2026, significant long liquidations on Ethereum totaled over $110 million as the Ethereum Foundation's quantum research team advanced efforts to integrate post-quantum signature schemes and prioritized upcoming security upgrades. The same day saw Ethereum ecosystem projects leading in development activity based on recent blockchain metrics.
Bearish momentum and oversold signals cap upside in narrow range
Technical indicators remain predominantly bearish, with price action below the SMA-20, SMA-50, and SMA-200 levels. Immediate resistance is at the Ichimoku Kijun level of $2,151.08, while momentum oscillators on the daily chart — MACD and ADX — show neutral direction and weak trend strength. Oversold signals are present in RSI (42.78), Stoch RSI (1.78), and CCI (–108.16), and intraday Bull/Bear Power (BBP at –45.30) continues to reflect seller dominance, with daily volatility subdued and sideways trading establishing a narrow price band.
Sideways price bias as low bullish probability constrains near-term moves
For the next five trading days, ETH is expected to move within a typical volatility band of $1,900 – $2,110. The probability of a short-term price increase is very low, at less than 20%, due to the absence of bullish cues from the weekly RSI, ADX, MACD, and MA-50. If ETH breaks above the $2,151 immediate resistance, a bullish scenario could develop, while a move below $1,900 would trigger further downside. The base scenario favors continued sideways movement within this corridor.
persistent bearish sentiment and technical weakness dominating Ethereum's short- to long-term outlook. The continuation of subdued volatility and repeated failure to reclaim major moving averages reinforce this cautious stance, with traders advised to monitor for a decisive breakout above $2,151 or a breakdown below $1,900 as signals for the next directional move.


Latest Ethereum News


-
 Afghanistan
-
 Albania
-
 Algeria
-
 Angola
-
 Argentina
-
 Armenia
-
 Australia
-
 Austria
-
 Azerbaijan
-
 Bahamas
-
 Bahrain
-
 Bangladesh
-
 Belarus
-
 Belgium
-
 Bolivia
-
 Botswana
-
 Brazil
-
 Brunei
-
 Bulgaria
-
 Cambodia
-
 Cameroon
-
 Canada
-
 Chile
Chile
-
 China
China
-
 Colombia
-
 Congo
Congo
-
 Costa Rica
-
 Cote d'Ivoire
-
 Croatia
-
 Cuba
Cuba
-
 Cyprus
-
 Czechia
-
 DR Congo
-
 Denmark
-
 Dominican Republic
-
 Ecuador
-
 Egypt
Egypt
-
 El Salvador
-
 Estonia
-
 Eswatini
-
 Ethiopia
-
 Finland
-
 France
-
 Georgia
-
 Germany
-
 Ghana
Ghana
-
 Greece
-
 Haiti
Haiti
-
 Hong Kong
-
 Hungary
-
 India
India
-
 Indonesia
-
 Iran, Islamic republic
-
 Iraq
Iraq
-
 Ireland
-
 Israel
-
 Italy
Italy
-
 Jamaica
-
 Japan
Japan
-
 Jordan
-
 Kazakhstan
-
 Kenya
Kenya
-
 Korea
Korea
-
 Kuwait
-
 Kyrgyzstan
-
 Laos
Laos
-
 Latvia
-
 Lebanon
-
 Lesotho
-
 Libya
Libya
-
 Lithuania
-
 Luxembourg
-
 Madagascar
-
 Malaysia
-
 Malta
Malta
-
 Mauritius
-
 Mexico
-
 Moldova
-
 Mongolia
-
 Montenegro
-
 Morocco
-
 Mozambique
-
 Myanmar
-
 Namibia
-
 Nepal
Nepal
-
 Netherlands
-
 New Zealand
-
 Nigeria
-
 North Macedonia
-
 Norway
-
 Oman
Oman
-
 Pakistan
-
 Palestine
-
 Panama
-
 Papua New Guinea
-
 Paraguay
-
 Peru
Peru
-
 Philippines
-
 Poland
-
 Portugal
-
 Puerto Rico
-
 Qatar
Qatar
-
 Reunion
-
 Romania
-
 Rwanda
-
 Saudi Arabia
-
 Serbia
-
 Singapore
-
 Slovakia
-
 Slovenia
-
 Somalia
-
 South Africa
-
 Spain
Spain
-
 Sri Lanka
-
 Sweden
-
 Switzerland
-
 Syria
Syria
-
 Taiwan
-
 Tajikistan
-
 Tanzania
-
 Thailand
-
 Trinidad and Tobago
-
 Tunisia
-
 Turkey
-
 UAE
UAE
-
 Uganda
-
 Ukraine
-
 United Kingdom
-
United States
-
 Uruguay
-
 Uzbekistan
-
 Venezuela
-
 Vietnam
-
 Yemen
Yemen
-
 Zambia
-
 Zimbabwe
- Forex
- Crypto
