
Short-term price rally lifts Theta 8.75% higher

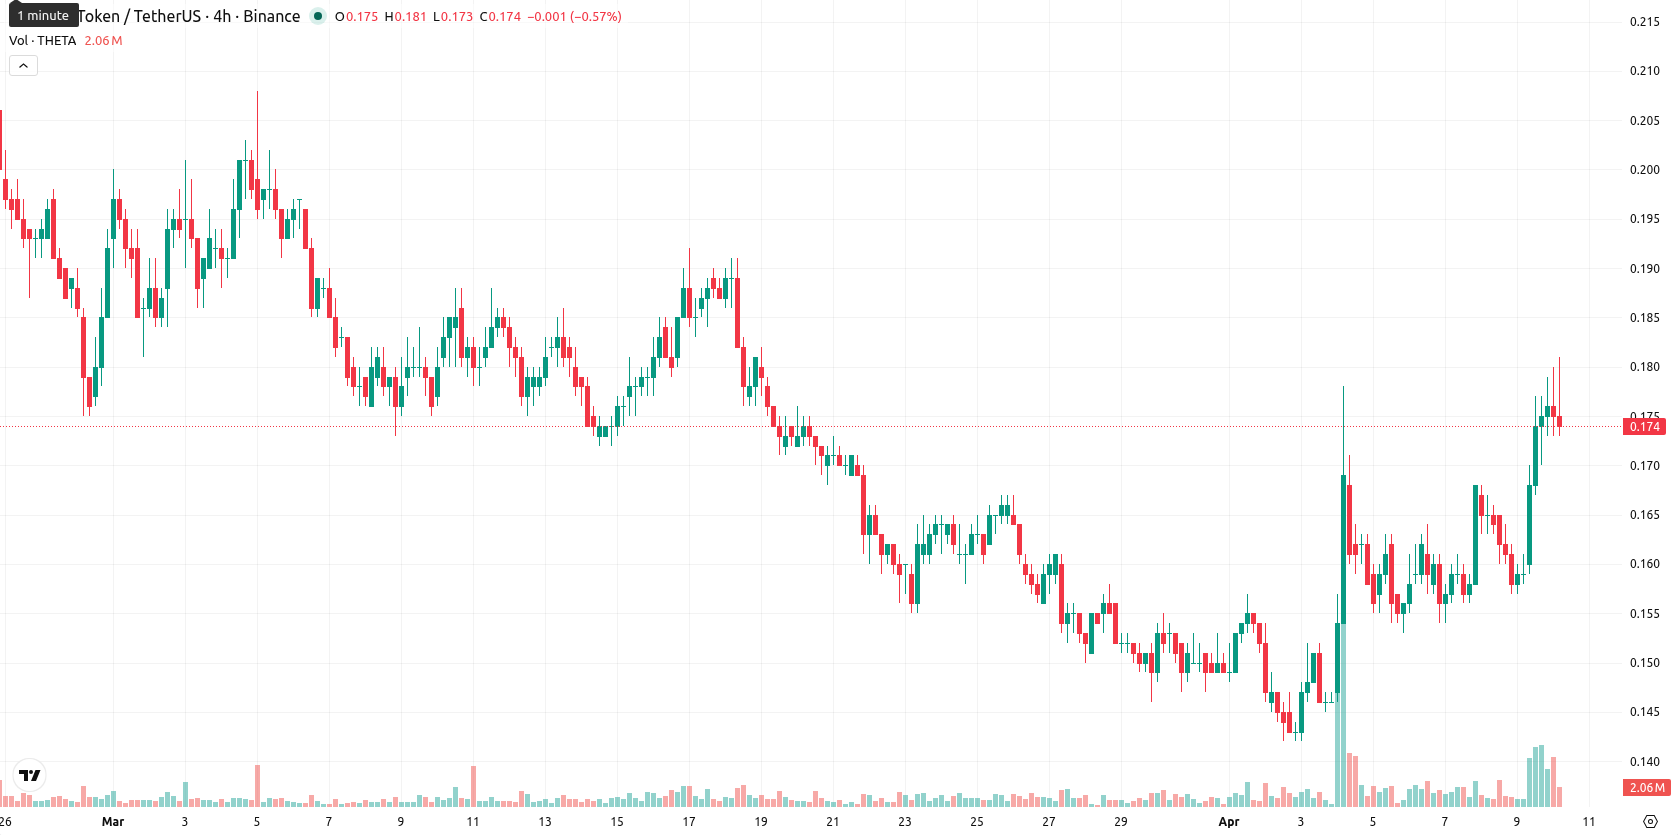
Theta (THETA) is trading at $0.174, up 8.75% on the day. The asset remains above its SMA-20 ($0.1570) and near SMA-50 ($0.1746), but far below the SMA-200 ($0.3424), reflecting a short-term bullish push within a broader long-term bearish trend.
 0.1403
0.1522000
0.1403
0.1522000
Highlights
- THETA shows a short-term bullish move above key short-term averages but remains in a dominant long-term downtrend.
- Oscillators indicate overbought conditions and mixed momentum, with recent upside likely facing exhaustion after an 8.75% gap-up open.
- Expected five-day range is $0.158–$0.180, with a downside bias unless the price sustains above $0.180; a drop below $0.167 could accelerate selling.
Mixed signals and elevated volatility amid overbought technicals
From a technical perspective, THETA stays above both the SMA-20 and the Ichimoku Kijun at $0.1670, which provides immediate support, while price action is near SMA-50 but remains far below the long-term SMA-200. Support lies at $0.167 and resistance is found near $0.180. Mixed momentum readings persist, with daily MACD signaling a strong sell, daily ADX showing modest bullishness, and oscillators such as RSI (56.7), CCI (154.2), and Stoch RSI indicating overbought conditions. BBP highlights strong buyer dominance on intraday frames, while wide intraday moves and a market gap at the open have resulted in high volatility and some profit-taking after initial strength.
Downside risk prevails as sideways range is anticipated
Looking ahead, the expected price range for THETA over the next 5 days falls within a typical volatility band of $0.158 – $0.180. The probability of further upside is less than 20%, with technical signals pointing to a greater likelihood of continued downside movement. The baseline scenario expects price to trade sideways between support at $0.167 and resistance at $0.180. A break above $0.180 could trigger a more significant bullish move, while a fall below $0.167 may open the way toward $0.158 and intensify selling pressure.
Earlier, analysts noted that despite some short-term technical strength, Theta remained under sustained long-term bearish pressure. The current setup reinforces this cautious outlook, with mixed signals and high volatility suggesting that traders should closely monitor for an eventual break above $0.180 or below $0.167 as the next catalyst for a directional move.















-
 Afghanistan
-
 Albania
-
 Algeria
-
 Angola
-
 Argentina
-
 Armenia
-
 Australia
-
 Austria
-
 Azerbaijan
-
 Bahamas
-
 Bahrain
-
 Bangladesh
-
 Belarus
-
 Belgium
-
 Bolivia
-
 Botswana
-
 Brazil
-
 Brunei
-
 Bulgaria
-
 Cambodia
-
 Cameroon
-
 Canada
-
 Chile
Chile
-
 China
China
-
 Colombia
-
 Congo
Congo
-
 Costa Rica
-
 Cote d'Ivoire
-
 Croatia
-
 Cuba
Cuba
-
 Cyprus
-
 Czechia
-
 DR Congo
-
 Denmark
-
 Dominican Republic
-
 Ecuador
-
 Egypt
Egypt
-
 El Salvador
-
 Estonia
-
 Eswatini
-
 Ethiopia
-
 Finland
-
 France
-
 Georgia
-
 Germany
-
 Ghana
Ghana
-
 Greece
-
 Haiti
Haiti
-
 Hong Kong
-
 Hungary
-
 India
India
-
 Indonesia
-
 Iran, Islamic republic
-
 Iraq
Iraq
-
 Ireland
-
 Israel
-
 Italy
Italy
-
 Jamaica
-
 Japan
Japan
-
 Jordan
-
 Kazakhstan
-
 Kenya
Kenya
-
 Korea
Korea
-
 Kuwait
-
 Kyrgyzstan
-
 Laos
Laos
-
 Latvia
-
 Lebanon
-
 Lesotho
-
 Libya
Libya
-
 Lithuania
-
 Luxembourg
-
 Madagascar
-
 Malaysia
-
 Malta
Malta
-
 Mauritius
-
 Mexico
-
 Moldova
-
 Mongolia
-
 Montenegro
-
 Morocco
-
 Mozambique
-
 Myanmar
-
 Namibia
-
 Nepal
Nepal
-
 Netherlands
-
 New Zealand
-
 Nigeria
-
 North Macedonia
-
 Norway
-
 Oman
Oman
-
 Pakistan
-
 Palestine
-
 Panama
-
 Papua New Guinea
-
 Paraguay
-
 Peru
Peru
-
 Philippines
-
 Poland
-
 Portugal
-
 Puerto Rico
-
 Qatar
Qatar
-
 Reunion
-
 Romania
-
 Rwanda
-
 Saudi Arabia
-
 Serbia
-
 Singapore
-
 Slovakia
-
 Slovenia
-
 Somalia
-
 South Africa
-
 Spain
Spain
-
 Sri Lanka
-
 Sweden
-
 Switzerland
-
 Syria
Syria
-
 Taiwan
-
 Tajikistan
-
 Tanzania
-
 Thailand
-
 Trinidad and Tobago
-
 Tunisia
-
 Turkey
-
 UAE
UAE
-
 Uganda
-
 Ukraine
-
 United Kingdom
-
United States
-
 Uruguay
-
 Uzbekistan
-
 Venezuela
-
 Vietnam
-
 Yemen
Yemen
-
 Zambia
-
 Zimbabwe
- Forex
- Crypto











