
Quant advances 1.97% with buyers in control near $77 after recent volatility: weekly forecast

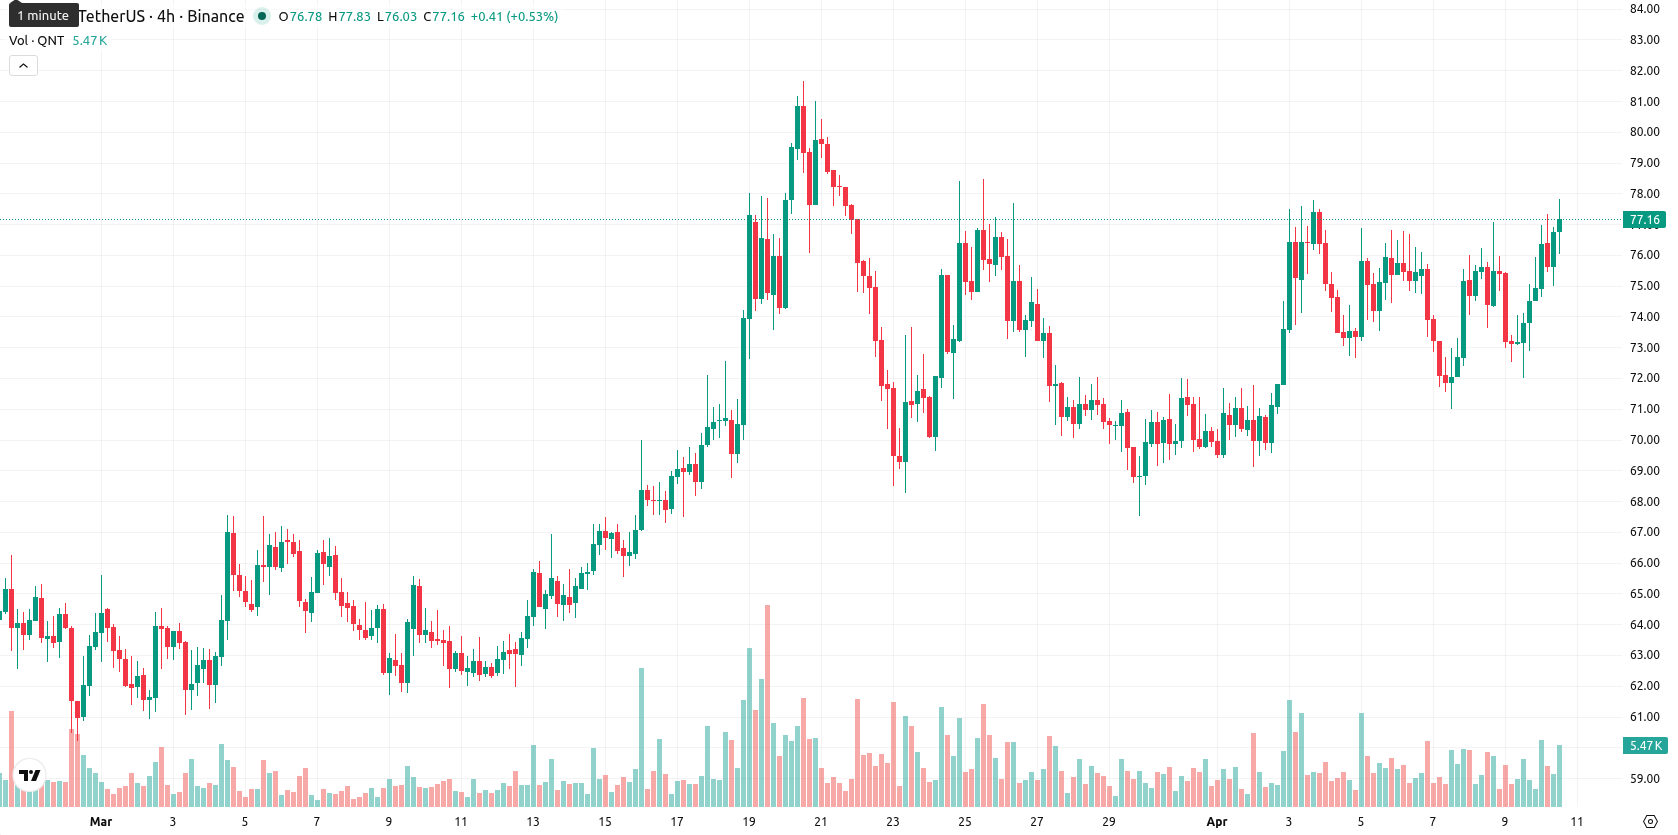
Quant (QNT) is currently trading at $77.01, recording a gain of $1.49 or 1.97% over the past week. The asset closed at the upper end of its weekly range, positioning itself above the weekly MA-20 ($73.63) but still below the MA-50 ($89.77) and MA-200 ($99.43), indicating short-term bullish momentum against broader medium- and long-term resistance.
Highlights
- Quant (QNT) shows short-term bullish momentum, trading above recent levels but below key longer-term resistances.
- Momentum signals remain mixed and mostly bearish, with indicator divergence and overbought readings pointing to the risk of a near-term pullback.
- QNT is forecast to consolidate between $75.50 and $79.50 in the coming week, with downside risk prevailing if $75.50 is breached.
Mixed technical signals with reversal risk as volatility spikes over the week
On the weekly chart, QNT trades above the MA-20 but below the MA-50 and MA-200, suggesting sellers still control the broader trend. Weekly indicators show mixed signals: the MACD issues a strong sell, the ADX is low, and the RSI presents a neutral to bearish stance. Despite Bull/Bear Power reflecting current buyer dominance, oscillators such as the Stochastic RSI and Bull/Bear Power are both in overbought territory, while the CCI remains neutral. The asset experienced notable weekly volatility at 8.54% and closed near weekly resistance, with substantial divergence among indicators highlighting a risk of reversal.
Consolidation favored in coming week amid neutral momentum and breakout risk
For the next 7 days, QNT is expected to consolidate in a narrow corridor between $75.50 and $79.50. Momentum indicators do not signal further upside — making a downside break more likely if $75.50 is breached. A move above $79.50 could trigger a short-lived bullish scenario, but the baseline expectation is for sideways trading as both buyers and sellers approach equilibrium near weekly resistance.
Earlier, analysts noted that Quant was exhibiting short-term bullish momentum despite persistent longer-term resistance and the risk of reversal. The latest technical evidence affirms this dynamic, underscoring the importance of the $75.50 level as a potential pivot where a downside break could accelerate sellers' control in the coming week.


-
 Afghanistan
-
 Albania
-
 Algeria
-
 Angola
-
 Argentina
-
 Armenia
-
 Australia
-
 Austria
-
 Azerbaijan
-
 Bahamas
-
 Bahrain
-
 Bangladesh
-
 Belarus
-
 Belgium
-
 Bolivia
-
 Botswana
-
 Brazil
-
 Brunei
-
 Bulgaria
-
 Cambodia
-
 Cameroon
-
 Canada
-
 Chile
Chile
-
 China
China
-
 Colombia
-
 Congo
Congo
-
 Costa Rica
-
 Cote d'Ivoire
-
 Croatia
-
 Cuba
Cuba
-
 Cyprus
-
 Czechia
-
 DR Congo
-
 Denmark
-
 Dominican Republic
-
 Ecuador
-
 Egypt
Egypt
-
 El Salvador
-
 Estonia
-
 Eswatini
-
 Ethiopia
-
 Finland
-
 France
-
 Georgia
-
 Germany
-
 Ghana
Ghana
-
 Greece
-
 Haiti
Haiti
-
 Hong Kong
-
 Hungary
-
 India
India
-
 Indonesia
-
 Iran, Islamic republic
-
 Iraq
Iraq
-
 Ireland
-
 Israel
-
 Italy
Italy
-
 Jamaica
-
 Japan
Japan
-
 Jordan
-
 Kazakhstan
-
 Kenya
Kenya
-
 Korea
Korea
-
 Kuwait
-
 Kyrgyzstan
-
 Laos
Laos
-
 Latvia
-
 Lebanon
-
 Lesotho
-
 Libya
Libya
-
 Lithuania
-
 Luxembourg
-
 Madagascar
-
 Malaysia
-
 Malta
Malta
-
 Mauritius
-
 Mexico
-
 Moldova
-
 Mongolia
-
 Montenegro
-
 Morocco
-
 Mozambique
-
 Myanmar
-
 Namibia
-
 Nepal
Nepal
-
 Netherlands
-
 New Zealand
-
 Nigeria
-
 North Macedonia
-
 Norway
-
 Oman
Oman
-
 Pakistan
-
 Palestine
-
 Panama
-
 Papua New Guinea
-
 Paraguay
-
 Peru
Peru
-
 Philippines
-
 Poland
-
 Portugal
-
 Puerto Rico
-
 Qatar
Qatar
-
 Reunion
-
 Romania
-
 Rwanda
-
 Saudi Arabia
-
 Serbia
-
 Singapore
-
 Slovakia
-
 Slovenia
-
 Somalia
-
 South Africa
-
 Spain
Spain
-
 Sri Lanka
-
 Sweden
-
 Switzerland
-
 Syria
Syria
-
 Taiwan
-
 Tajikistan
-
 Tanzania
-
 Thailand
-
 Trinidad and Tobago
-
 Tunisia
-
 Turkey
-
 UAE
UAE
-
 Uganda
-
 Ukraine
-
 United Kingdom
-
United States
-
 Uruguay
-
 Uzbekistan
-
 Venezuela
-
 Vietnam
-
 Yemen
Yemen
-
 Zambia
-
 Zimbabwe
- Forex
- Crypto
