
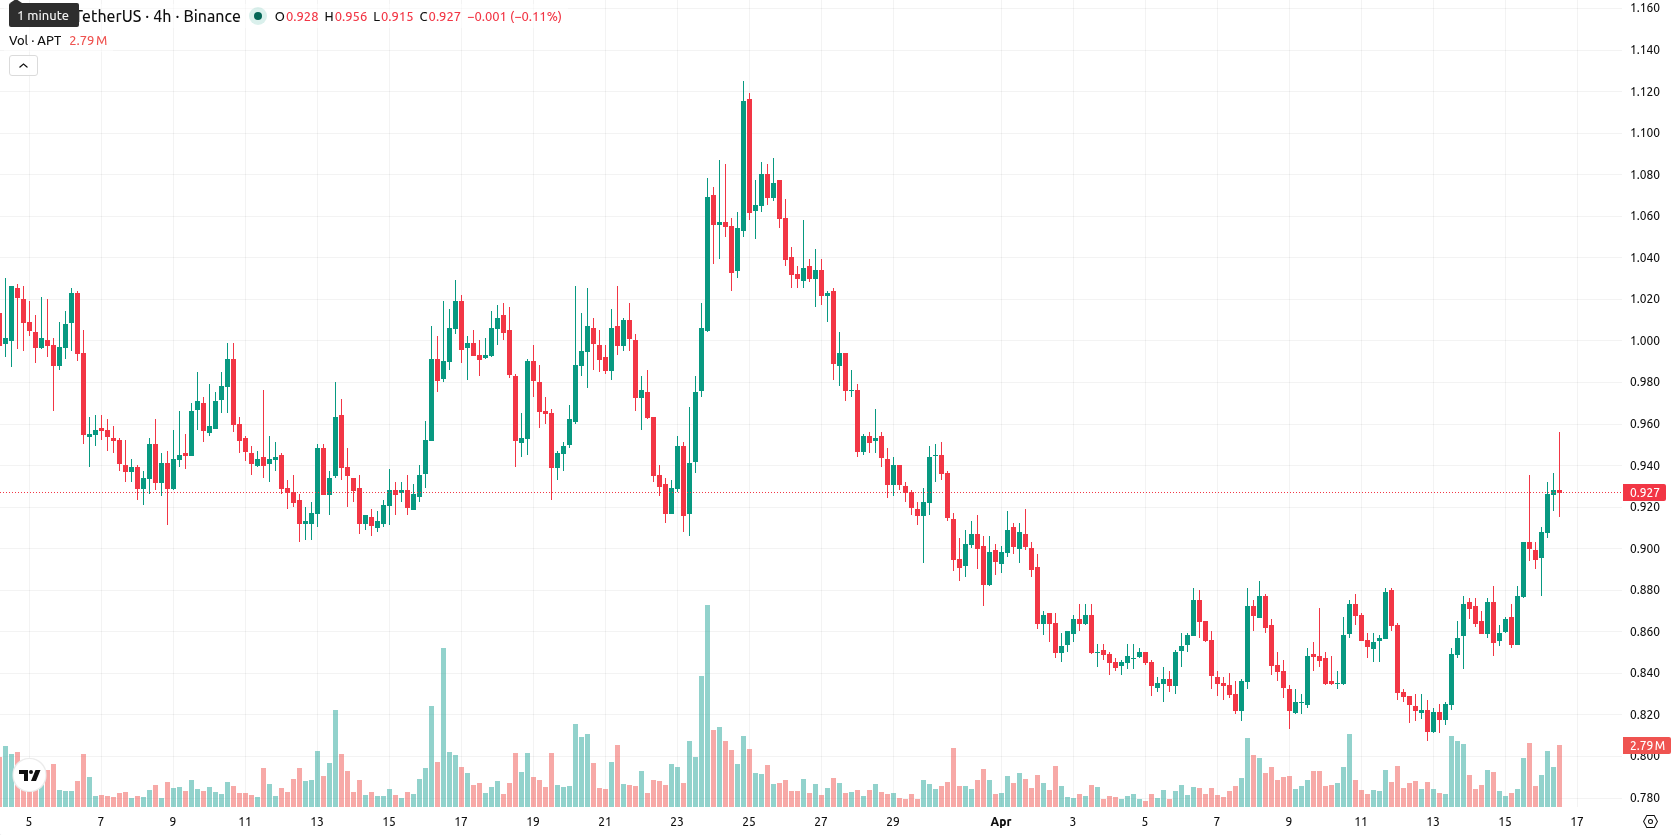
Aptos gains 11.62% as it trades below key moving averages: weekly outlook

Aptos (APT) is trading at $0.92, which is below both the weekly MA-20 ($1.2415) and MA-50 ($3.0780), indicating sustained medium- and long-term pressure from sellers. Over the past week, APT has risen $0.094 (11.62%) and is now near the top of its weekly range, but remains beneath its key moving averages.
Highlights
- APT faces sustained selling pressure, trading below key moving average levels with no effective nearby support.
- Momentum indicators including MACD and ADX signal a strong bearish trend, despite a recent short-term bounce from oversold territory.
- The next 7-day trading range is expected between $0.80 and $1.06, with a higher probability of decline or sideways movement than a breakout.
bearish signals persist despite rebound as oscillators diverge during the week
On the weekly chart, momentum indicators confirm a bearish environment: the MACD signals a strong sell, the ADX reflects a persistent downtrend, and Bull/Bear Power remains negative, highlighting continued selling pressure. Although the RSI and CCI both register oversold conditions, the Stochastic RSI signals a strong buy, creating notable divergence among oscillators. The weekly Ichimoku Kijun level sits far above the current price and is not a meaningful reference point, making the MA-20 the nearest dynamic resistance. Weekly volatility stands at 15.86%, with the recent rebound primarily correcting from recent lows rather than signaling a trend reversal.
sideways consolidation likely as indicators show weak recovery prospects
Over the next 7 days, APT is expected to trade between $0.80 and $1.06, reflecting a sideways corridor aligned with recent volatility. There is a low probability (less than 20%) of a sustained upward move, as none of the four key weekly indicators suggest a Buy or Strong Buy. The baseline scenario favors consolidation within this range, while a drop below $0.80 could renew the dominant downtrend. A breakout above $1.06 would be required to initiate any meaningful recovery if weekly momentum improves.
In a recent review, Aptos was described as facing persistent downward pressure with limited prospects for a sustained upside despite short-term volatility. This analysis remains intact, as current indicators continue to favor consolidation within a broad range, with $1.06 emerging as the pivotal level to monitor for any potential bullish breakout in the coming week.


-
 Afghanistan
-
 Albania
-
 Algeria
-
 Angola
-
 Argentina
-
 Armenia
-
 Australia
-
 Austria
-
 Azerbaijan
-
 Bahamas
-
 Bahrain
-
 Bangladesh
-
 Belarus
-
 Belgium
-
 Bolivia
-
 Botswana
-
 Brazil
-
 Brunei
-
 Bulgaria
-
 Cambodia
-
 Cameroon
-
 Canada
-
 Chile
Chile
-
 China
China
-
 Colombia
-
 Congo
Congo
-
 Costa Rica
-
 Cote d'Ivoire
-
 Croatia
-
 Cuba
Cuba
-
 Cyprus
-
 Czechia
-
 DR Congo
-
 Denmark
-
 Dominican Republic
-
 Ecuador
-
 Egypt
Egypt
-
 El Salvador
-
 Estonia
-
 Eswatini
-
 Ethiopia
-
 Finland
-
 France
-
 Georgia
-
 Germany
-
 Ghana
Ghana
-
 Greece
-
 Haiti
Haiti
-
 Hong Kong
-
 Hungary
-
 India
India
-
 Indonesia
-
 Iran, Islamic republic
-
 Iraq
Iraq
-
 Ireland
-
 Israel
-
 Italy
Italy
-
 Jamaica
-
 Japan
Japan
-
 Jordan
-
 Kazakhstan
-
 Kenya
Kenya
-
 Korea
Korea
-
 Kuwait
-
 Kyrgyzstan
-
 Laos
Laos
-
 Latvia
-
 Lebanon
-
 Lesotho
-
 Libya
Libya
-
 Lithuania
-
 Luxembourg
-
 Madagascar
-
 Malaysia
-
 Malta
Malta
-
 Mauritius
-
 Mexico
-
 Moldova
-
 Mongolia
-
 Montenegro
-
 Morocco
-
 Mozambique
-
 Myanmar
-
 Namibia
-
 Nepal
Nepal
-
 Netherlands
-
 New Zealand
-
 Nigeria
-
 North Macedonia
-
 Norway
-
 Oman
Oman
-
 Pakistan
-
 Palestine
-
 Panama
-
 Papua New Guinea
-
 Paraguay
-
 Peru
Peru
-
 Philippines
-
 Poland
-
 Portugal
-
 Puerto Rico
-
 Qatar
Qatar
-
 Reunion
-
 Romania
-
 Rwanda
-
 Saudi Arabia
-
 Serbia
-
 Singapore
-
 Slovakia
-
 Slovenia
-
 Somalia
-
 South Africa
-
 Spain
Spain
-
 Sri Lanka
-
 Sweden
-
 Switzerland
-
 Syria
Syria
-
 Taiwan
-
 Tajikistan
-
 Tanzania
-
 Thailand
-
 Trinidad and Tobago
-
 Tunisia
-
 Turkey
-
 UAE
UAE
-
 Uganda
-
 Ukraine
-
 United Kingdom
-
United States
-
 Uruguay
-
 Uzbekistan
-
 Venezuela
-
 Vietnam
-
 Yemen
Yemen
-
 Zambia
-
 Zimbabwe
- Forex
- Crypto
