
Sui advances within recent range with MACD flashing strong sell signal: weekly forecast

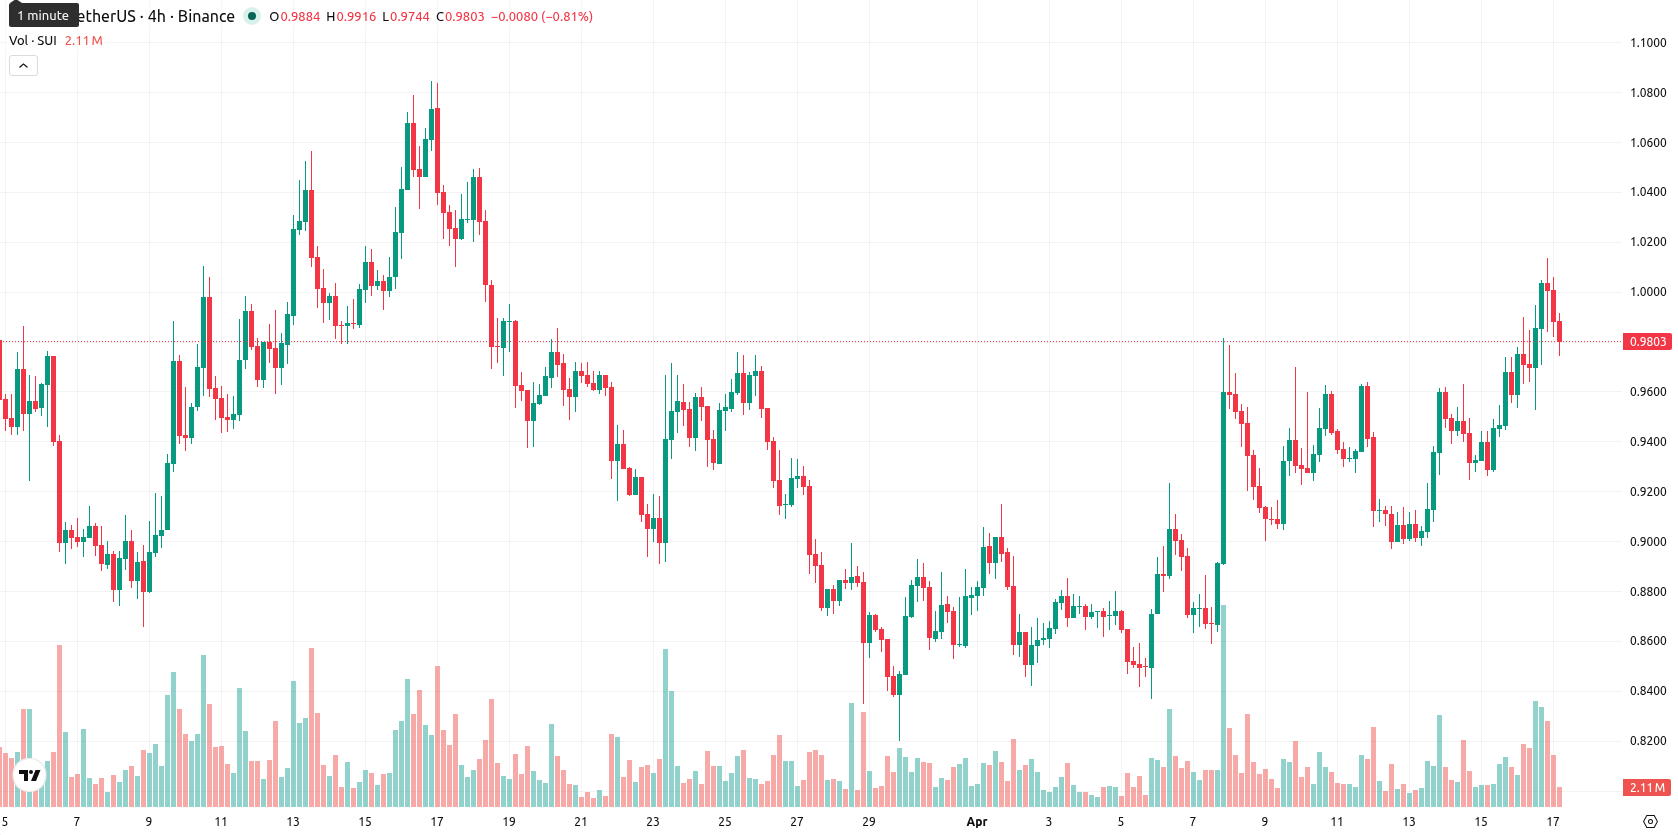
Sui (SUI) is currently trading at $0.9793, which is below its weekly MA-20 at $1.1954 and MA-50 at $2.3536, highlighting persistent medium- and long-term pressure from sellers. Over the past week, SUI has advanced $0.0390, or 4.18%, positioning itself in the upper section of the recent weekly range.
 0.7711
0.7744
0.7711
0.7744
Highlights
- SUI trades below key moving averages, reflecting ongoing medium- and long-term bearish pressure despite a recent minor rebound.
- Bearish momentum prevails, with multiple indicators signaling continued seller dominance and no signs of an oversold reversal.
- SUI is expected to consolidate between $0.88 and $1.08 over the next week, with a higher likelihood of downward movement unless resistance at $1.08 is broken.
Stronger weekly interest as trading volume surges without new developments
Sui saw a notable 37% increase in trading volume this week, reflecting renewed market interest and stronger liquidity within its ecosystem. The higher volume indicates greater engagement and activity among participants. No further material corporate developments for Sui were reported during this period.
Mixed-to-bearish momentum as SUI lags behind key weekly technicals
On the weekly timeframe, SUI remains under pressure as it trades below both the MA-20 ($1.1954) and MA-50 ($2.3536), with the MA-20 acting as the nearest dynamic resistance. Momentum signals on W1 are negative: MACD displays a strong sell indication, ADX confirms the dominance of sellers, and both RSI and CCI are in the sell zone but are not oversold. The Stochastic RSI is neutral, while Bull/Bear Power continues to reflect bearish strength. Volatility for the week stands at 13.02%, and SUI’s modest bounce has yet to break the overall mixed-to-bearish technical backdrop.
Sideways consolidation likely as upside breakout risk remains subdued
In the coming 7 days, SUI is projected to trade within a $0.88 to $1.08 corridor, in line with its current volatility and the technical landscape. The likelihood of a breakout to the upside is low, with less than a 20% chance as indicated by the lack of buy signals across key weekly indicators. The baseline scenario points to sideways movement and ongoing consolidation within this range. A move above $1.08 would open room for a test of higher resistance, while a break below $0.88 signals renewed downward momentum.
Earlier, analysts noted that Sui was experiencing short-term price recoveries amid persistent medium- and long-term bearish pressures. The latest data—highlighted by a surge in trading volume and continued negative momentum signals—reinforces the expectation for sideways consolidation, with volatility-driven opportunities best managed by monitoring the $0.88 and $1.08 boundary in the days ahead.








-
 Afghanistan
-
 Albania
-
 Algeria
-
 Angola
-
 Argentina
-
 Armenia
-
 Australia
-
 Austria
-
 Azerbaijan
-
 Bahamas
-
 Bahrain
-
 Bangladesh
-
 Belarus
-
 Belgium
-
 Bolivia
-
 Botswana
-
 Brazil
-
 Brunei
-
 Bulgaria
-
 Cambodia
-
 Cameroon
-
 Canada
-
 Chile
Chile
-
 China
China
-
 Colombia
-
 Congo
Congo
-
 Costa Rica
-
 Cote d'Ivoire
-
 Croatia
-
 Cuba
Cuba
-
 Cyprus
-
 Czechia
-
 DR Congo
-
 Denmark
-
 Dominican Republic
-
 Ecuador
-
 Egypt
Egypt
-
 El Salvador
-
 Estonia
-
 Eswatini
-
 Ethiopia
-
 Finland
-
 France
-
 Georgia
-
 Germany
-
 Ghana
Ghana
-
 Greece
-
 Haiti
Haiti
-
 Hong Kong
-
 Hungary
-
 India
India
-
 Indonesia
-
 Iran, Islamic republic
-
 Iraq
Iraq
-
 Ireland
-
 Israel
-
 Italy
Italy
-
 Jamaica
-
 Japan
Japan
-
 Jordan
-
 Kazakhstan
-
 Kenya
Kenya
-
 Korea
Korea
-
 Kuwait
-
 Kyrgyzstan
-
 Laos
Laos
-
 Latvia
-
 Lebanon
-
 Lesotho
-
 Libya
Libya
-
 Lithuania
-
 Luxembourg
-
 Madagascar
-
 Malaysia
-
 Malta
Malta
-
 Mauritius
-
 Mexico
-
 Moldova
-
 Mongolia
-
 Montenegro
-
 Morocco
-
 Mozambique
-
 Myanmar
-
 Namibia
-
 Nepal
Nepal
-
 Netherlands
-
 New Zealand
-
 Nigeria
-
 North Macedonia
-
 Norway
-
 Oman
Oman
-
 Pakistan
-
 Palestine
-
 Panama
-
 Papua New Guinea
-
 Paraguay
-
 Peru
Peru
-
 Philippines
-
 Poland
-
 Portugal
-
 Puerto Rico
-
 Qatar
Qatar
-
 Reunion
-
 Romania
-
 Rwanda
-
 Saudi Arabia
-
 Serbia
-
 Singapore
-
 Slovakia
-
 Slovenia
-
 Somalia
-
 South Africa
-
 Spain
Spain
-
 Sri Lanka
-
 Sweden
-
 Switzerland
-
 Syria
Syria
-
 Taiwan
-
 Tajikistan
-
 Tanzania
-
 Thailand
-
 Trinidad and Tobago
-
 Tunisia
-
 Turkey
-
 UAE
UAE
-
 Uganda
-
 Ukraine
-
 United Kingdom
-
United States
-
 Uruguay
-
 Uzbekistan
-
 Venezuela
-
 Vietnam
-
 Yemen
Yemen
-
 Zambia
-
 Zimbabwe
- Forex
- Crypto











