
Theta drops 9.40% as price struggles to recover from extended undervaluation

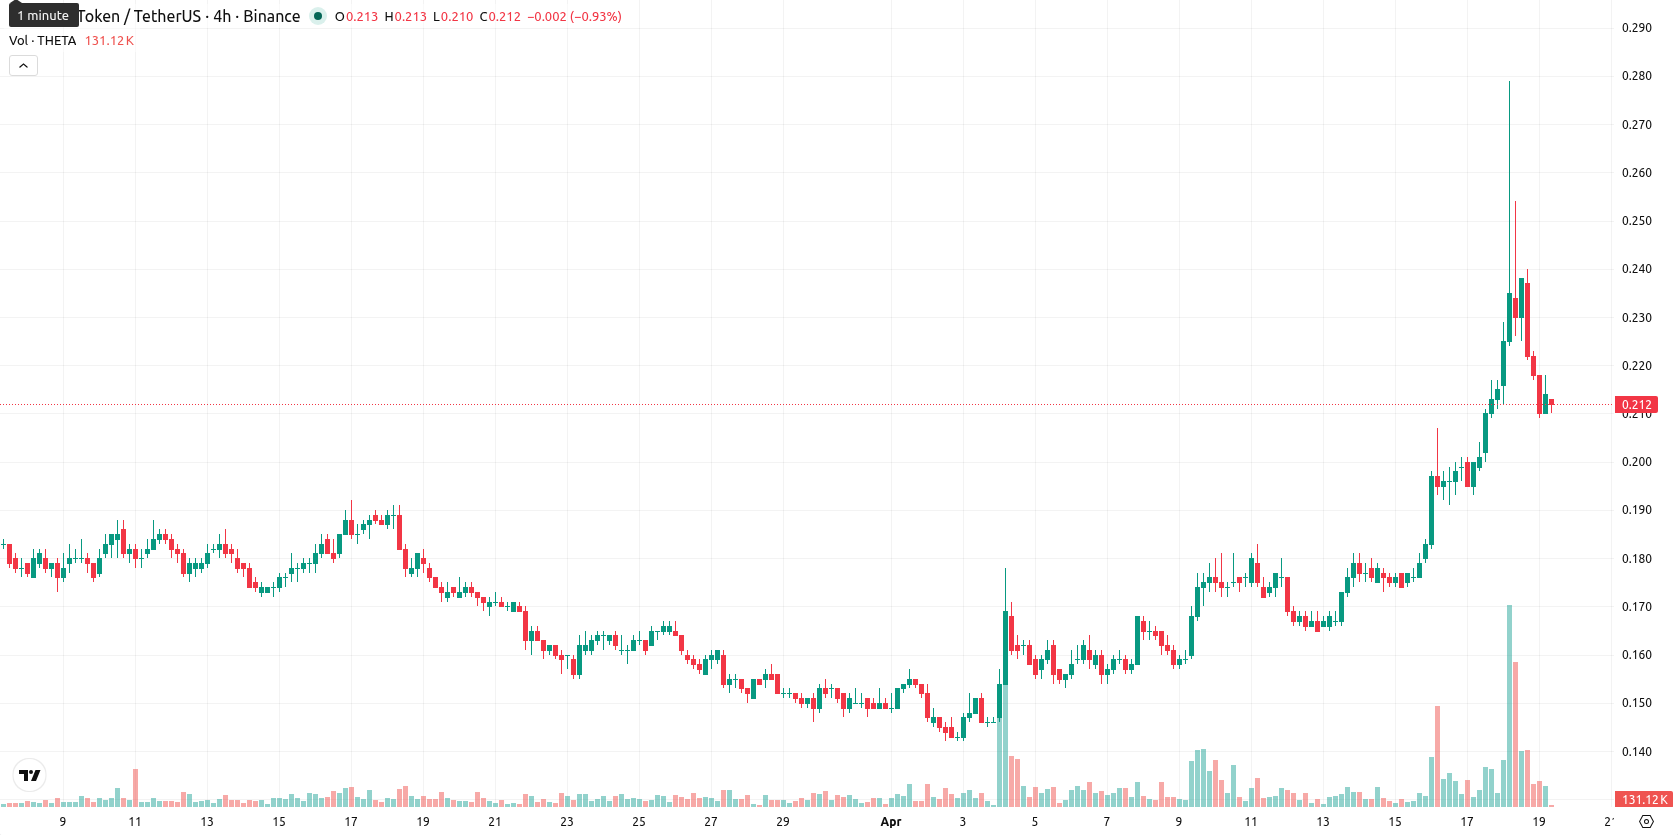
Theta (THETA) is trading at $0.212, well above both the SMA-20 ($0.17005) and SMA-50 ($0.1736), confirming short- and medium-term bullish momentum. However, it remains distinctly below the SMA-200 ($0.31879), signaling that the long-term trend is still under pressure from sellers.
 0.1403
0.1522000
0.1403
0.1522000
Highlights
- THETA shows short- and medium-term bullish momentum, but the long-term trend remains under pressure from sellers.
- Momentum indicators flag overbought conditions, signaling limited upside and increasing risk of a near-term pullback.
- Expect THETA to trade sideways between $0.200 and $0.225 this week, with downside risk prevailing if support at $0.200 fails.
Intraday volatility and overbought signals clash with bullish momentum
Momentum indicators on D1 show some divergence: MACD and ADX both suggest ongoing bullish momentum, while RSI (72.06), Stoch RSI (100), and CCI (266.9) all flag overbought conditions, indicating limited upward room. BBP is positive, reflecting buyer dominance intraday, and the Awesome Oscillator also supports the bullish tone. Today's price opened below the previous close — with no notable gap — and currently sits near the low of the $0.209 – $0.218 range, after falling 9.40%. Intraday volatility has been high, and the session is showing continued pressure after the open, which slightly contradicts the broader bullish momentum signals. The Ichimoku Kijun is at $0.207, which sits below the current price and serves as immediate support.
Downside risk increases as breakout signals remain absent
For the coming week, the expected trading range is adjusted to $0.200 – $0.225 to reflect recent price action and volatility. The probability of a price increase is very low (less than 20%), making a further decline more likely. Baseline scenario: THETA trades sideways within $0.200 – $0.225. Bullish scenario: a break above $0.225 could open upside toward new short-term highs, while a drop below $0.200 would indicate renewed selling and risk further downside.
Earlier, analysts noted that Theta was exhibiting strong short- and medium-term bullish momentum, but faced persistent long-term resistance alongside heightened volatility and overbought signals. The latest market action bolsters this view, with continued downside pressure despite intraday buyer dominance, making sustained moves below $0.200 a critical risk to monitor in the week ahead.















-
 Afghanistan
-
 Albania
-
 Algeria
-
 Angola
-
 Argentina
-
 Armenia
-
 Australia
-
 Austria
-
 Azerbaijan
-
 Bahamas
-
 Bahrain
-
 Bangladesh
-
 Belarus
-
 Belgium
-
 Bolivia
-
 Botswana
-
 Brazil
-
 Brunei
-
 Bulgaria
-
 Cambodia
-
 Cameroon
-
 Canada
-
 Chile
Chile
-
 China
China
-
 Colombia
-
 Congo
Congo
-
 Costa Rica
-
 Cote d'Ivoire
-
 Croatia
-
 Cuba
Cuba
-
 Cyprus
-
 Czechia
-
 DR Congo
-
 Denmark
-
 Dominican Republic
-
 Ecuador
-
 Egypt
Egypt
-
 El Salvador
-
 Estonia
-
 Eswatini
-
 Ethiopia
-
 Finland
-
 France
-
 Georgia
-
 Germany
-
 Ghana
Ghana
-
 Greece
-
 Haiti
Haiti
-
 Hong Kong
-
 Hungary
-
 India
India
-
 Indonesia
-
 Iran, Islamic republic
-
 Iraq
Iraq
-
 Ireland
-
 Israel
-
 Italy
Italy
-
 Jamaica
-
 Japan
Japan
-
 Jordan
-
 Kazakhstan
-
 Kenya
Kenya
-
 Korea
Korea
-
 Kuwait
-
 Kyrgyzstan
-
 Laos
Laos
-
 Latvia
-
 Lebanon
-
 Lesotho
-
 Libya
Libya
-
 Lithuania
-
 Luxembourg
-
 Madagascar
-
 Malaysia
-
 Malta
Malta
-
 Mauritius
-
 Mexico
-
 Moldova
-
 Mongolia
-
 Montenegro
-
 Morocco
-
 Mozambique
-
 Myanmar
-
 Namibia
-
 Nepal
Nepal
-
 Netherlands
-
 New Zealand
-
 Nigeria
-
 North Macedonia
-
 Norway
-
 Oman
Oman
-
 Pakistan
-
 Palestine
-
 Panama
-
 Papua New Guinea
-
 Paraguay
-
 Peru
Peru
-
 Philippines
-
 Poland
-
 Portugal
-
 Puerto Rico
-
 Qatar
Qatar
-
 Reunion
-
 Romania
-
 Rwanda
-
 Saudi Arabia
-
 Serbia
-
 Singapore
-
 Slovakia
-
 Slovenia
-
 Somalia
-
 South Africa
-
 Spain
Spain
-
 Sri Lanka
-
 Sweden
-
 Switzerland
-
 Syria
Syria
-
 Taiwan
-
 Tajikistan
-
 Tanzania
-
 Thailand
-
 Trinidad and Tobago
-
 Tunisia
-
 Turkey
-
 UAE
UAE
-
 Uganda
-
 Ukraine
-
 United Kingdom
-
United States
-
 Uruguay
-
 Uzbekistan
-
 Venezuela
-
 Vietnam
-
 Yemen
Yemen
-
 Zambia
-
 Zimbabwe
- Forex
- Crypto











