
High-volume advance lifts Dash 16.19% in a show of fresh support

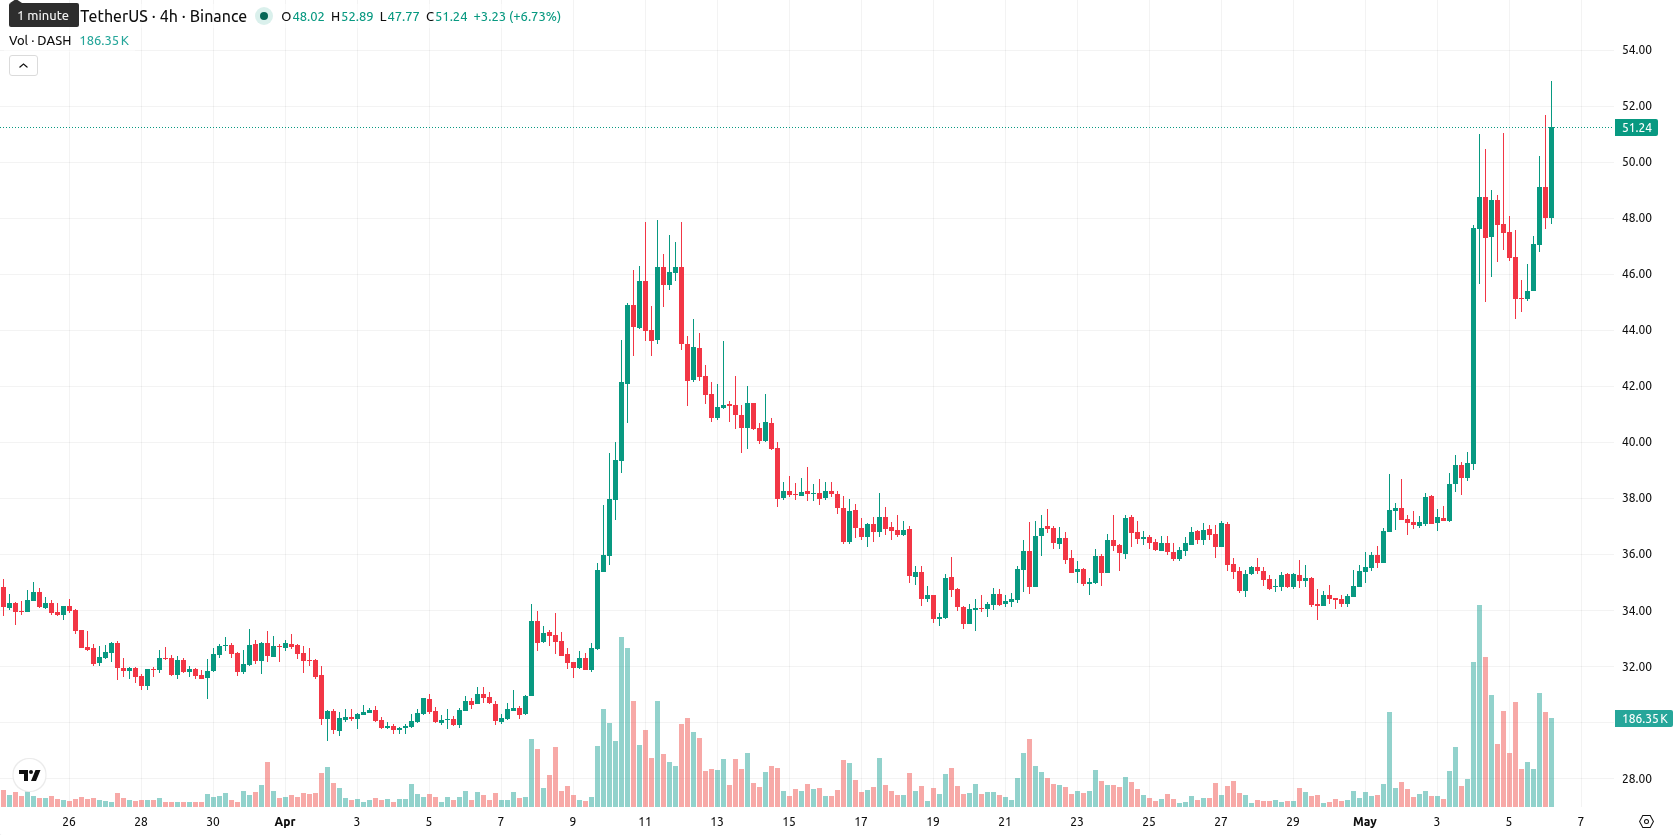
Dash (DASH) is trading at $52.11, up 16.19% for the day. The current price sits well above its key moving averages, reflecting strong short-term momentum.
 189.49
195.65
189.49
195.65
Highlights
- DASH trades with strong bullish momentum, supported by price action well above key medium- and long-term moving averages.
- Overbought signals and high volatility indicate an elevated risk of short-term pullback or consolidation despite persistent buying pressure.
- DASH is expected to consolidate in a $47.00–$56.50 corridor over the next five trading days unless it breaks above or below these levels.
Momentum overextension as technicals flash bullish signals
On the daily chart, DASH has closed above the SMA-20 ($37.19), SMA-50 ($35.39), and SMA-200 ($46.77), highlighting clear upward breakouts across all monitored averages. The Ichimoku Kijun line on D1 sits at $42.15, now acting as newly established support. The daily MACD supports a buy signal, while the ADX reads 17.37, indicating moderate trend strength. Momentum is tilted heavily in favor of buyers, with the RSI at 74.37 showing strong overbought conditions, and the CCI (330.52) and Bull/Bear Power (BBP: 10.51) both flagging significant buyer dominance. The Awesome Oscillator remains bullish, while the sharp gap-up open and current price near intraday highs suggest sustained volatility but raise the risk of a near-term pullback due to stretched oscillators.
Further upside likely as bullish indicators outweigh pullback risks
In the coming five sessions, DASH is expected to fluctuate within a typical volatility band of $47.00 to $56.50. The probability of further upside is high, with more than 80% likelihood based on a majority of bullish weekly indicators. Consolidation within this corridor is the base case. A sustained break above $56.50 would open the path to higher upside, whereas a move below $47.00 could result in a correction down to the Ichimoku Kijun support area.
Earlier, analysts noted that Dash’s strong upward momentum was accompanied by overbought signals and an elevated risk of near-term volatility. The latest technical readings reinforce this bullish setup but also amplify caution, making close monitoring of any sustained moves above $56.50 crucial for traders assessing risk and opportunity.








-
 Afghanistan
-
 Albania
-
 Algeria
-
 Angola
-
 Argentina
-
 Armenia
-
 Australia
-
 Austria
-
 Azerbaijan
-
 Bahamas
-
 Bahrain
-
 Bangladesh
-
 Belarus
-
 Belgium
-
 Bolivia
-
 Botswana
-
 Brazil
-
 Brunei
-
 Bulgaria
-
 Cambodia
-
 Cameroon
-
 Canada
-
 Chile
Chile
-
 China
China
-
 Colombia
-
 Congo
Congo
-
 Costa Rica
-
 Cote d'Ivoire
-
 Croatia
-
 Cuba
Cuba
-
 Cyprus
-
 Czechia
-
 DR Congo
-
 Denmark
-
 Dominican Republic
-
 Ecuador
-
 Egypt
Egypt
-
 El Salvador
-
 Estonia
-
 Eswatini
-
 Ethiopia
-
 Finland
-
 France
-
 Georgia
-
 Germany
-
 Ghana
Ghana
-
 Greece
-
 Haiti
Haiti
-
 Hong Kong
-
 Hungary
-
 India
India
-
 Indonesia
-
 Iran, Islamic republic
-
 Iraq
Iraq
-
 Ireland
-
 Israel
-
 Italy
Italy
-
 Jamaica
-
 Japan
Japan
-
 Jordan
-
 Kazakhstan
-
 Kenya
Kenya
-
 Korea
Korea
-
 Kuwait
-
 Kyrgyzstan
-
 Laos
Laos
-
 Latvia
-
 Lebanon
-
 Lesotho
-
 Libya
Libya
-
 Lithuania
-
 Luxembourg
-
 Madagascar
-
 Malaysia
-
 Malta
Malta
-
 Mauritius
-
 Mexico
-
 Moldova
-
 Mongolia
-
 Montenegro
-
 Morocco
-
 Mozambique
-
 Myanmar
-
 Namibia
-
 Nepal
Nepal
-
 Netherlands
-
 New Zealand
-
 Nigeria
-
 North Macedonia
-
 Norway
-
 Oman
Oman
-
 Pakistan
-
 Palestine
-
 Panama
-
 Papua New Guinea
-
 Paraguay
-
 Peru
Peru
-
 Philippines
-
 Poland
-
 Portugal
-
 Puerto Rico
-
 Qatar
Qatar
-
 Reunion
-
 Romania
-
 Rwanda
-
 Saudi Arabia
-
 Serbia
-
 Singapore
-
 Slovakia
-
 Slovenia
-
 Somalia
-
 South Africa
-
 Spain
Spain
-
 Sri Lanka
-
 Sweden
-
 Switzerland
-
 Syria
Syria
-
 Taiwan
-
 Tajikistan
-
 Tanzania
-
 Thailand
-
 Trinidad and Tobago
-
 Tunisia
-
 Turkey
-
 UAE
UAE
-
 Uganda
-
 Ukraine
-
 United Kingdom
-
United States
-
 Uruguay
-
 Uzbekistan
-
 Venezuela
-
 Vietnam
-
 Yemen
Yemen
-
 Zambia
-
 Zimbabwe
- Forex
- Crypto











