

DASH consolidates with support at $30.50 and resistance at $37.10: weekly forecast

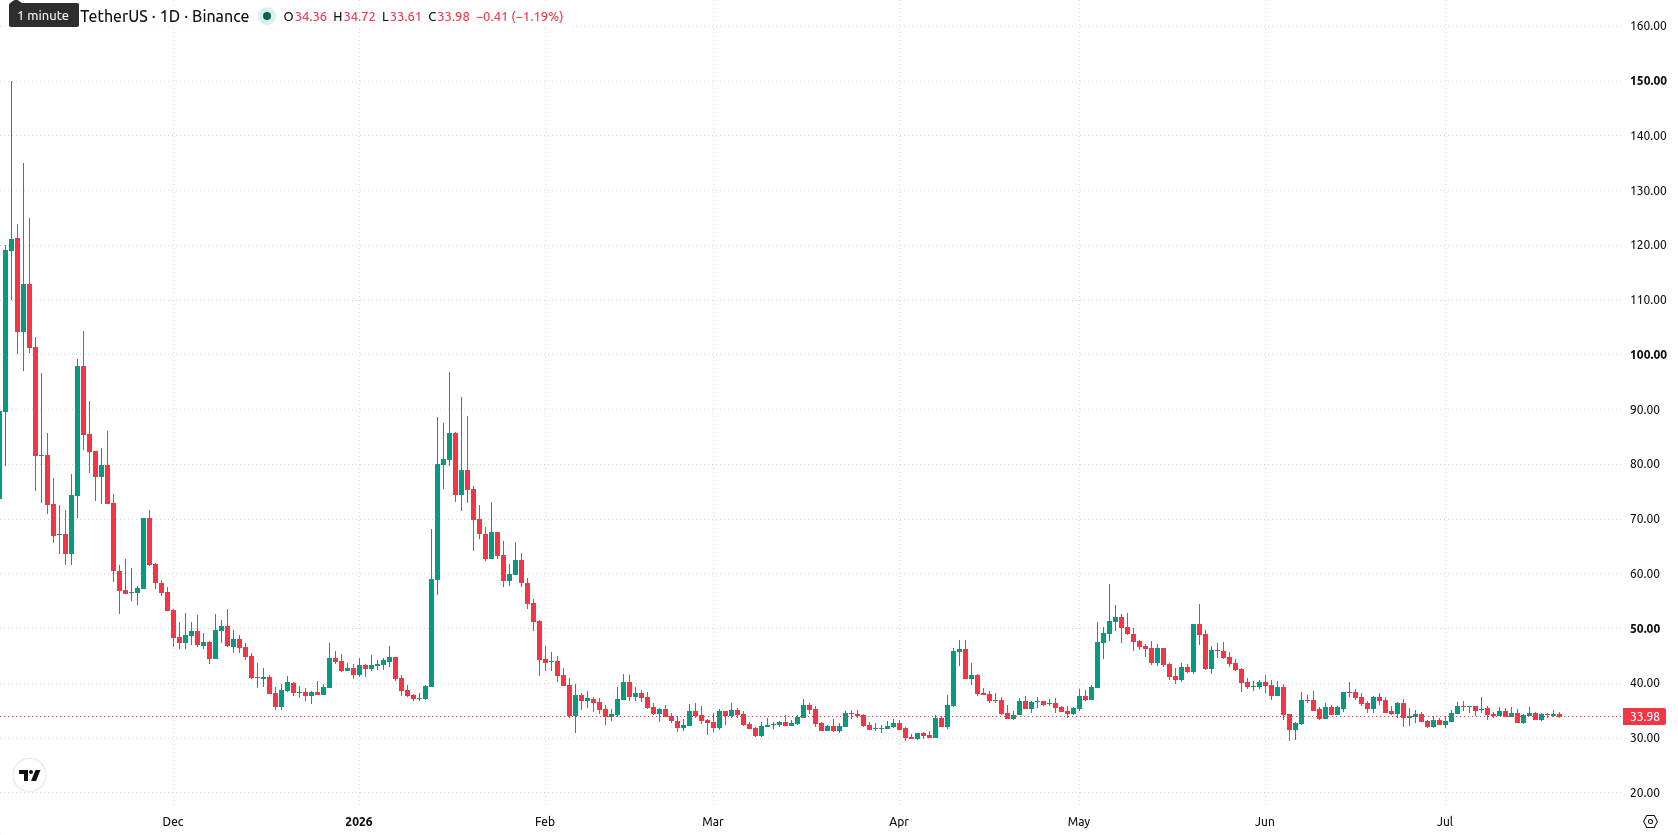
Dash (DASH) is currently trading at $33.88, marking a weekly decline of $0.25 or 0.73%. The asset is positioned below its major weekly moving averages: MA-20 at $36.49, MA-50 at $40.68, and MA-200 at $35.40, confirming sustained bearish momentum and continued seller pressure over the past seven days.
 196.58
197.34
196.58
197.34
Highlights
- Dash remains under bearish pressure, trading well below key moving averages and confirming a negative medium- to long-term trend.
- Oscillators suggest oversold short-term conditions, but sell-side momentum and dominance indicate a limited likelihood of immediate recovery.
- Expected range for the next week is $30.50 to $37.10, with a 75% probability of downside continuation if support breaks.
Indicators signal oversold conditions amid sustained resistance this week
On the weekly chart, Dash remains under its MA-20, MA-50, and MA-200, with the Ichimoku Kijun at $59.07, all acting as strong resistance levels above the current price. Volatility for the week stands at 9.84%, and the price is settle in the middle of its weekly range with support at $30.50 and resistance at $37.10. The RSI, Stochastic RSI, and CCI are in or near oversold territory, while MACD signals continued selling momentum and the ADX hints at modest but present trend strength. Bull/Bear Power underscores seller dominance this week.
Sideways or further downside favored as bearish signals persist
For the next 7 days, the anticipated trading range for Dash is $30.50 to $37.10, with weekly indicators signaling a high probability of continued sideways action or additional downside pressure. A breakout above $37.10 could open the door to a brief relief rally, but current signals favor bears with about 75% downside probability. The baseline expectation is for Dash to oscillate within this range, while a break below $30.50 would expose the asset to further declines.
Earlier, analysts noted that Dash was entrenched in a bearish trend with persistent selling momentum prevailing in recent sessions. The current analysis reinforces this view, highlighting that continued downward pressure and oversold conditions maintain downside risk as the dominant scenario, with $30.50 emerging as the key level to watch for potential further losses.










-
 Afghanistan
-
 Albania
-
 Algeria
-
 Angola
-
 Argentina
-
 Armenia
-
 Australia
-
 Austria
-
 Azerbaijan
-
 Bahamas
-
 Bahrain
-
 Bangladesh
-
 Belarus
-
 Belgium
-
 Bolivia
-
 Botswana
-
 Brazil
-
 Brunei
-
 Bulgaria
-
 Cambodia
-
 Cameroon
-
 Canada
-
 Chile
Chile
-
 China
China
-
 Colombia
-
 Congo
Congo
-
 Costa Rica
-
 Cote d'Ivoire
-
 Croatia
-
 Cuba
Cuba
-
 Cyprus
-
 Czechia
-
 DR Congo
-
 Denmark
-
 Dominican Republic
-
 Ecuador
-
 Egypt
Egypt
-
 El Salvador
-
 Estonia
-
 Eswatini
-
 Ethiopia
-
 Finland
-
 France
-
 Georgia
-
 Germany
-
 Ghana
Ghana
-
 Greece
-
 Haiti
Haiti
-
 Hong Kong
-
 Hungary
-
 India
India
-
 Indonesia
-
 Iran, Islamic republic
-
 Iraq
Iraq
-
 Ireland
-
 Israel
-
 Italy
Italy
-
 Jamaica
-
 Japan
Japan
-
 Jordan
-
 Kazakhstan
-
 Kenya
Kenya
-
 Korea
Korea
-
 Kuwait
-
 Kyrgyzstan
-
 Laos
Laos
-
 Latvia
-
 Lebanon
-
 Lesotho
-
 Libya
Libya
-
 Lithuania
-
 Luxembourg
-
 Madagascar
-
 Malaysia
-
 Malta
Malta
-
 Mauritius
-
 Mexico
-
 Moldova
-
 Mongolia
-
 Montenegro
-
 Morocco
-
 Mozambique
-
 Myanmar
-
 Namibia
-
 Nepal
Nepal
-
 Netherlands
-
 New Zealand
-
 Nigeria
-
 North Macedonia
-
 Norway
-
 Oman
Oman
-
 Pakistan
-
 Palestine
-
 Panama
-
 Papua New Guinea
-
 Paraguay
-
 Peru
Peru
-
 Philippines
-
 Poland
-
 Portugal
-
 Puerto Rico
-
 Qatar
Qatar
-
 Reunion
-
 Romania
-
 Rwanda
-
 Saudi Arabia
-
 Serbia
-
 Singapore
-
 Slovakia
-
 Slovenia
-
 Somalia
-
 South Africa
-
 Spain
Spain
-
 Sri Lanka
-
 Sweden
-
 Switzerland
-
 Syria
Syria
-
 Taiwan
-
 Tajikistan
-
 Tanzania
-
 Thailand
-
 Trinidad and Tobago
-
 Tunisia
-
 Turkey
-
 UAE
UAE
-
 Uganda
-
 Ukraine
-
 United Kingdom
-
United States
-
 Uruguay
-
 Uzbekistan
-
 Venezuela
-
 Vietnam
-
 Yemen
Yemen
-
 Zambia
-
 Zimbabwe
- Forex
- Crypto












