

Dash stalls below resistance with MACD and ADX signaling continued downside pressure: weekly analysis

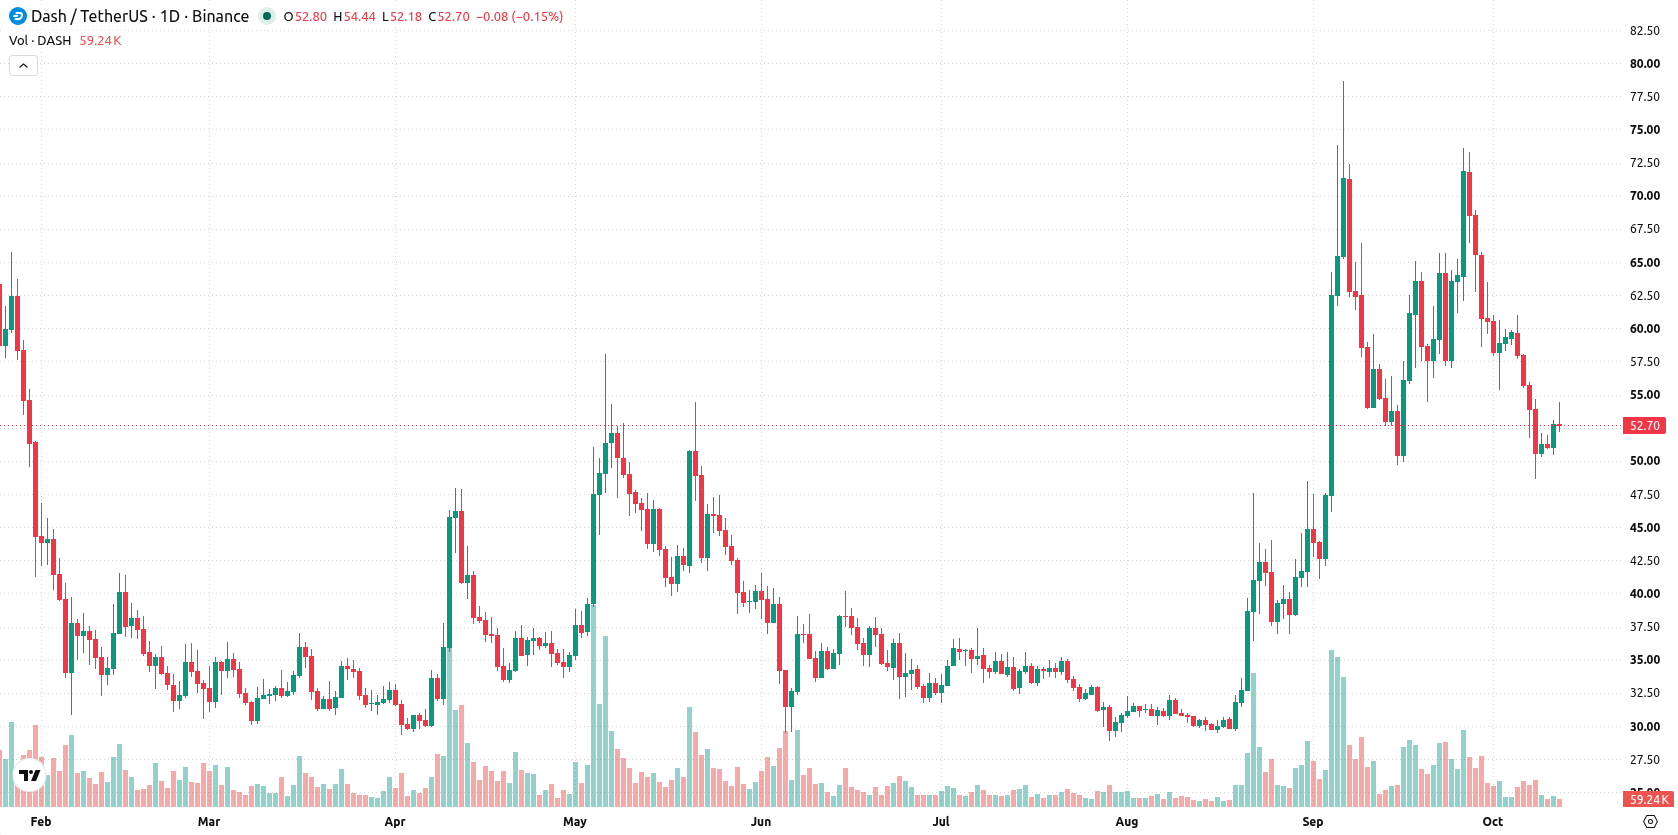
Dash (DASH) slid sharply over the past week, tumbling more than 13% to trade near $52. Renewed downside momentum, with key signals in oversold territory, has drawn support levels into focus and raised questions around a potential pause or reversal for the coming week.
 191.02
185.19
Highlights
- Dash trades at $52.72, dropping 13.32% over the past week, and remains in a bearish short-term structure.
- Technical momentum indicators show Dash in clear sell territory, though oversold signals create divergence in short-term signals.
- The expected range for the week ahead is $47.71 to $57.72, with $48.63 and $54.99 as key support and resistance.
Firm sell positioning develops as volatility and oversold signals intensify
The daily chart displays a firm trend lower, with momentum characterized as a sustained move lower with a firm trend. MACD and ADX both register in sell territory, while CCI at -118.1 and Stoch RSI at 18.09 point to oversold conditions, introducing some divergence in short-term signals. The nearest support sits at $48.63 and resistance is found at $54.99, with the Ichimoku Kijun at $61.14 above acting as a practical resistance. Volatility remains elevated at 19.43%, keeping the current downtrend in focus for the coming days.
Range-bound outlook ahead as breakout risk hinges on key support and resistance
In the week ahead, the expected range is $47.71 to $57.72, with a 48% probability of an increase and a 52% probability of a decrease. The base case is for trading to continue between support at $48.63 and resistance at $54.99. A bullish scenario would require a push above $54.99 with targets toward $57.72, while a bearish break below $48.63 would open downside risk toward the lower edge of the forecast range at $47.71.
Earlier, analysts noted that Dash was under sustained downside pressure, with technical signals highlighting bearish momentum amid elevated volatility. The current analysis strengthens this view as fresh lows and persistent oversold conditions place particular emphasis on a potential downside break below $48.63 as the next key risk to monitor.










-
 Afghanistan
-
 Albania
-
 Algeria
-
 Angola
-
 Argentina
-
 Armenia
-
 Australia
-
 Austria
-
 Azerbaijan
-
 Bahamas
-
 Bahrain
-
 Bangladesh
-
 Belarus
-
 Belgium
-
 Bolivia
-
 Botswana
-
 Brazil
-
 Brunei
-
 Bulgaria
-
 Cambodia
-
 Cameroon
-
 Canada
-
 Chile
-
 China
-
 Colombia
-
 Congo
-
 Costa Rica
-
 Cote d'Ivoire
-
 Croatia
-
 Cuba
-
 Cyprus
-
 Czechia
-
 DR Congo
-
 Denmark
-
 Dominican Republic
-
 Ecuador
-
 Egypt
-
 El Salvador
-
 Estonia
-
 Eswatini
-
 Ethiopia
-
 Finland
-
 France
-
 Georgia
-
 Germany
-
 Ghana
-
 Greece
-
 Haiti
-
 Hong Kong
-
 Hungary
-
 India
-
 Indonesia
-
 Iran, Islamic republic
-
 Iraq
-
 Ireland
-
 Israel
-
 Italy
-
 Jamaica
-
 Japan
-
 Jordan
-
 Kazakhstan
-
 Kenya
-
 Korea
-
 Kuwait
-
 Kyrgyzstan
-
 Laos
-
 Latvia
-
 Lebanon
-
 Lesotho
-
 Libya
-
 Lithuania
-
 Luxembourg
-
 Madagascar
-
 Malaysia
-
 Malta
-
 Mauritius
-
 Mexico
-
 Moldova
-
 Mongolia
-
 Montenegro
-
 Morocco
-
 Mozambique
-
 Myanmar
-
 Namibia
-
 Nepal
-
 Netherlands
-
 New Zealand
-
 Nigeria
-
 North Macedonia
-
 Norway
-
 Oman
-
 Pakistan
-
 Palestine
-
 Panama
-
 Papua New Guinea
-
 Paraguay
-
 Peru
-
 Philippines
-
 Poland
-
 Portugal
-
 Puerto Rico
-
 Qatar
-
 Reunion
-
 Romania
-
 Rwanda
-
 Saudi Arabia
-
 Serbia
-
 Singapore
-
 Slovakia
-
 Slovenia
-
 Somalia
-
 South Africa
-
 Spain
-
 Sri Lanka
-
 Sweden
-
 Switzerland
-
 Syria
-
 Taiwan
-
 Tajikistan
-
 Tanzania
-
 Thailand
-
 Trinidad and Tobago
-
 Tunisia
-
 Turkey
-
 UAE
-
 Uganda
-
 Ukraine
-
 United Kingdom
-
United States
-
 Uruguay
-
 Uzbekistan
-
 Venezuela
-
 Vietnam
-
 Yemen
-
 Zambia
-
 Zimbabwe
- Forex
- Crypto












