

Dash support comes into focus after a stretched decline: weekly analysis

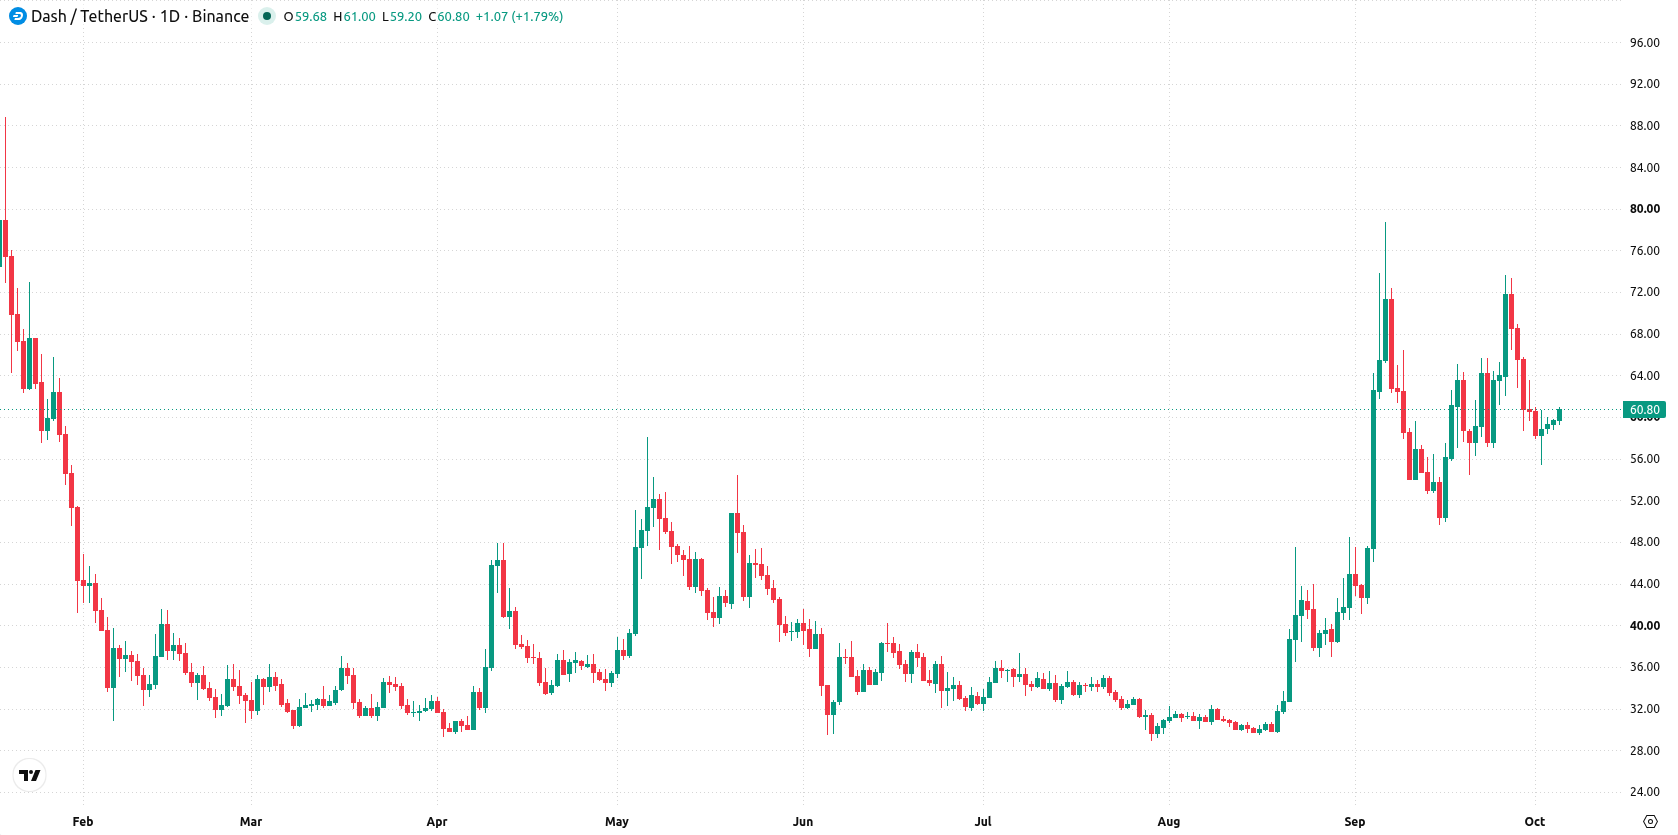
Dash is trading around $61 after a nearly 8% slide this week, as bearish momentum and oversold signals heighten focus on the recent stretch lower. The daily chart highlights a technical standoff between trend persistence and mounting pressure near support, setting up a key test for the coming days.
 187.15
191.02
Highlights
- Dash dropped 7.65% over the past week to $60.85, returning to its 20-day moving average and testing short-term equilibrium.
- Technical readings show weak short-term momentum and oversold conditions, but the overall trend remains bullish.
- Price is expected to move between $48.68 and $66.33, with key levels at $60.96 resistance and $55.38 support.
Oversold signals intensify as ADX steadies uptrend over the week
On the daily chart, momentum remains weak with a sustained move lower and a firm trend, as seen in the 18.73% volatility for the week. ADX at 36.13 signals a trending market, but the Stochastic RSI in oversold territory at 7.22 underlines heavy short-term pressure, even as the MACD maintains a strong buy posture. Immediate resistance is at $60.96, where price is pinned to its MA-20, while support lingers below at $55.38; the Ichimoku Kijun at $61.65 reinforces overhead resistance. This mix of signals highlights a critical zone, with price action tightly balanced between oversold momentum and trend persistence.
Breakout risk heightens next week as price tests support and resistance
In the week ahead, Dash is expected to move within a range of $48.68 to $66.33. There is a 70% probability of an increase and a 30% probability of a decrease. The base case suggests price will oscillate between $55.38 support and $60.96 resistance. A sustained break above $60.96 opens the way for a test of $66.33, while a drop below $55.38 would turn the focus toward the lower edge of the expected range near $48.68.
Earlier, analysts noted that Dash was under sustained downside pressure, with technical conditions favoring bearish momentum amid heightened volatility. The latest analysis adds that a break below $55.38 would expose the asset to deeper declines toward $48.68, making this support level critical to monitor in the near term.










-
 Afghanistan
-
 Albania
-
 Algeria
-
 Angola
-
 Argentina
-
 Armenia
-
 Australia
-
 Austria
-
 Azerbaijan
-
 Bahamas
-
 Bahrain
-
 Bangladesh
-
 Belarus
-
 Belgium
-
 Bolivia
-
 Botswana
-
 Brazil
-
 Brunei
-
 Bulgaria
-
 Cambodia
-
 Cameroon
-
 Canada
-
 Chile
-
 China
-
 Colombia
-
 Congo
-
 Costa Rica
-
 Cote d'Ivoire
-
 Croatia
-
 Cuba
-
 Cyprus
-
 Czechia
-
 DR Congo
-
 Denmark
-
 Dominican Republic
-
 Ecuador
-
 Egypt
-
 El Salvador
-
 Estonia
-
 Eswatini
-
 Ethiopia
-
 Finland
-
 France
-
 Georgia
-
 Germany
-
 Ghana
-
 Greece
-
 Haiti
-
 Hong Kong
-
 Hungary
-
 India
-
 Indonesia
-
 Iran, Islamic republic
-
 Iraq
-
 Ireland
-
 Israel
-
 Italy
-
 Jamaica
-
 Japan
-
 Jordan
-
 Kazakhstan
-
 Kenya
-
 Korea
-
 Kuwait
-
 Kyrgyzstan
-
 Laos
-
 Latvia
-
 Lebanon
-
 Lesotho
-
 Libya
-
 Lithuania
-
 Luxembourg
-
 Madagascar
-
 Malaysia
-
 Malta
-
 Mauritius
-
 Mexico
-
 Moldova
-
 Mongolia
-
 Montenegro
-
 Morocco
-
 Mozambique
-
 Myanmar
-
 Namibia
-
 Nepal
-
 Netherlands
-
 New Zealand
-
 Nigeria
-
 North Macedonia
-
 Norway
-
 Oman
-
 Pakistan
-
 Palestine
-
 Panama
-
 Papua New Guinea
-
 Paraguay
-
 Peru
-
 Philippines
-
 Poland
-
 Portugal
-
 Puerto Rico
-
 Qatar
-
 Reunion
-
 Romania
-
 Rwanda
-
 Saudi Arabia
-
 Serbia
-
 Singapore
-
 Slovakia
-
 Slovenia
-
 Somalia
-
 South Africa
-
 Spain
-
 Sri Lanka
-
 Sweden
-
 Switzerland
-
 Syria
-
 Taiwan
-
 Tajikistan
-
 Tanzania
-
 Thailand
-
 Trinidad and Tobago
-
 Tunisia
-
 Turkey
-
 UAE
-
 Uganda
-
 Ukraine
-
 United Kingdom
-
United States
-
 Uruguay
-
 Uzbekistan
-
 Venezuela
-
 Vietnam
-
 Yemen
-
 Zambia
-
 Zimbabwe
- Forex
- Crypto












