

Long-term resistance caps gains as Raydium rises 7.02% on strong trading action

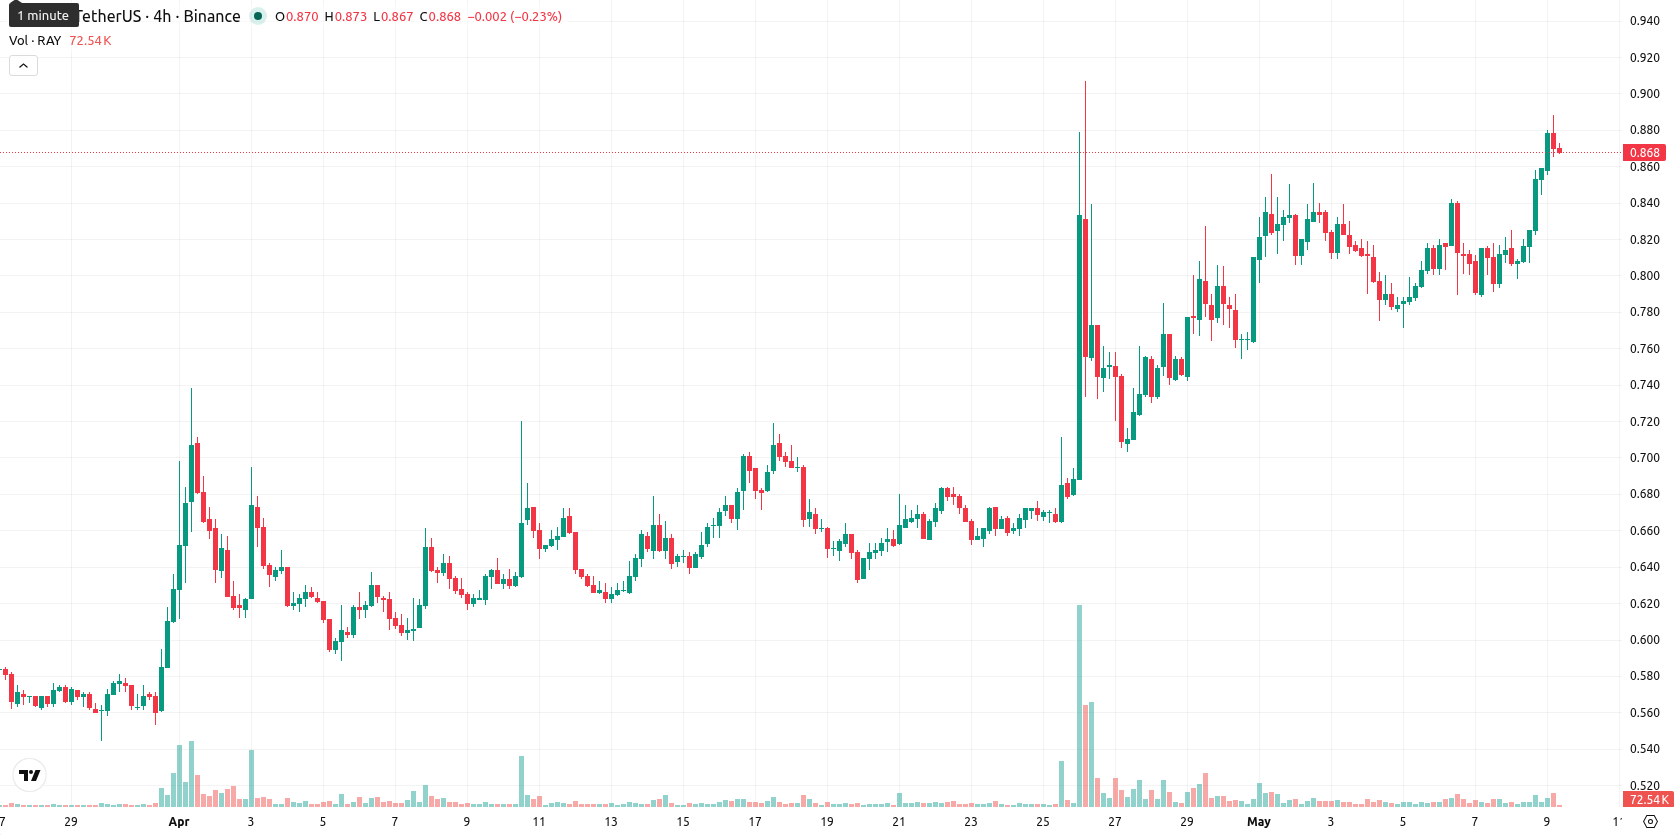
Raydium (RAY) is trading at $0.869, up 7.02% on the day, and currently sits above its key moving averages. The asset maintains strength relative to recent momentum levels.
 2.0868
2.5300
2.0868
2.5300
Highlights
- RAY is trading with strong short- and medium-term bullish momentum but faces resistance below the longer-term SMA-200 at $0.9277.
- Momentum indicators reflect persistent buying pressure and an active uptrend, though overbought signals suggest risk of short-term exhaustion.
- Over the next five trading days, RAY is projected to fluctuate sideways between $0.860 and $0.924, with a downside bias outweighing breakout probability.
Bullish momentum as resistance and overbought signals converge
RAY has cleared the SMA-20 ($0.7513) and SMA-50 ($0.6753) but remains capped by the SMA-200 at $0.9277. The Ichimoku Kijun on the daily chart sits at $0.7635, marking notable support below the current price. Both MACD and ADX confirm a strong uptrend, while RSI at 71.86 indicates the asset is now in slightly overbought territory. Stoch RSI reads as neutral but is approaching overbought, with CCI signaling ongoing buying activity. BBP maintains a positive bias, and the Awesome Oscillator is neutral. Today's session began with a distinct upside gap ($0.812 to $0.858), and price surged toward the session's high at $0.888, reflecting heightened volatility and bullish intraday momentum.
Sideways trend likely as breakout hopes remain limited
Over the next five trading days, RAY is likely to fluctuate within a typical volatility band from $0.860 to $0.924. The probability of a continued upward breakout is low (less than 20%), with the base scenario being sideways action inside this corridor. A move above $0.924 would require renewed momentum to overcome long-term resistance, while a drop below $0.860 and loss of immediate support could lead to deeper retracements given the weak multi-week structure above.
Earlier, analysts noted that Raydium was showing strong bullish momentum but faced the likelihood of short-term consolidation as overbought conditions emerged. The current technical setup reaffirms the pattern of robust demand balanced by resistance near higher levels, suggesting traders should watch for a decisive move above $0.924 or a breakdown below $0.860 as the next direction-setting event.





Latest Raydium News





-
 Afghanistan
-
 Albania
-
 Algeria
-
 Angola
-
 Argentina
-
 Armenia
-
 Australia
-
 Austria
-
 Azerbaijan
-
 Bahamas
-
 Bahrain
-
 Bangladesh
-
 Belarus
-
 Belgium
-
 Bolivia
-
 Botswana
-
 Brazil
-
 Brunei
-
 Bulgaria
-
 Cambodia
-
 Cameroon
-
 Canada
-
 Chile
Chile
-
 China
China
-
 Colombia
-
 Congo
Congo
-
 Costa Rica
-
 Cote d'Ivoire
-
 Croatia
-
 Cuba
Cuba
-
 Cyprus
-
 Czechia
-
 DR Congo
-
 Denmark
-
 Dominican Republic
-
 Ecuador
-
 Egypt
Egypt
-
 El Salvador
-
 Estonia
-
 Eswatini
-
 Ethiopia
-
 Finland
-
 France
-
 Georgia
-
 Germany
-
 Ghana
Ghana
-
 Greece
-
 Haiti
Haiti
-
 Hong Kong
-
 Hungary
-
 India
India
-
 Indonesia
-
 Iran, Islamic republic
-
 Iraq
Iraq
-
 Ireland
-
 Israel
-
 Italy
Italy
-
 Jamaica
-
 Japan
Japan
-
 Jordan
-
 Kazakhstan
-
 Kenya
Kenya
-
 Korea
Korea
-
 Kuwait
-
 Kyrgyzstan
-
 Laos
Laos
-
 Latvia
-
 Lebanon
-
 Lesotho
-
 Libya
Libya
-
 Lithuania
-
 Luxembourg
-
 Madagascar
-
 Malaysia
-
 Malta
Malta
-
 Mauritius
-
 Mexico
-
 Moldova
-
 Mongolia
-
 Montenegro
-
 Morocco
-
 Mozambique
-
 Myanmar
-
 Namibia
-
 Nepal
Nepal
-
 Netherlands
-
 New Zealand
-
 Nigeria
-
 North Macedonia
-
 Norway
-
 Oman
Oman
-
 Pakistan
-
 Palestine
-
 Panama
-
 Papua New Guinea
-
 Paraguay
-
 Peru
Peru
-
 Philippines
-
 Poland
-
 Portugal
-
 Puerto Rico
-
 Qatar
Qatar
-
 Reunion
-
 Romania
-
 Rwanda
-
 Saudi Arabia
-
 Serbia
-
 Singapore
-
 Slovakia
-
 Slovenia
-
 Somalia
-
 South Africa
-
 Spain
Spain
-
 Sri Lanka
-
 Sweden
-
 Switzerland
-
 Syria
Syria
-
 Taiwan
-
 Tajikistan
-
 Tanzania
-
 Thailand
-
 Trinidad and Tobago
-
 Tunisia
-
 Turkey
-
 UAE
UAE
-
 Uganda
-
 Ukraine
-
 United Kingdom
-
United States
-
 Uruguay
-
 Uzbekistan
-
 Venezuela
-
 Vietnam
-
 Yemen
Yemen
-
 Zambia
-
 Zimbabwe
- Forex
- Crypto












