
Sei price prediction: Watching $0.0858 resistance as SEI climbs 12.68%

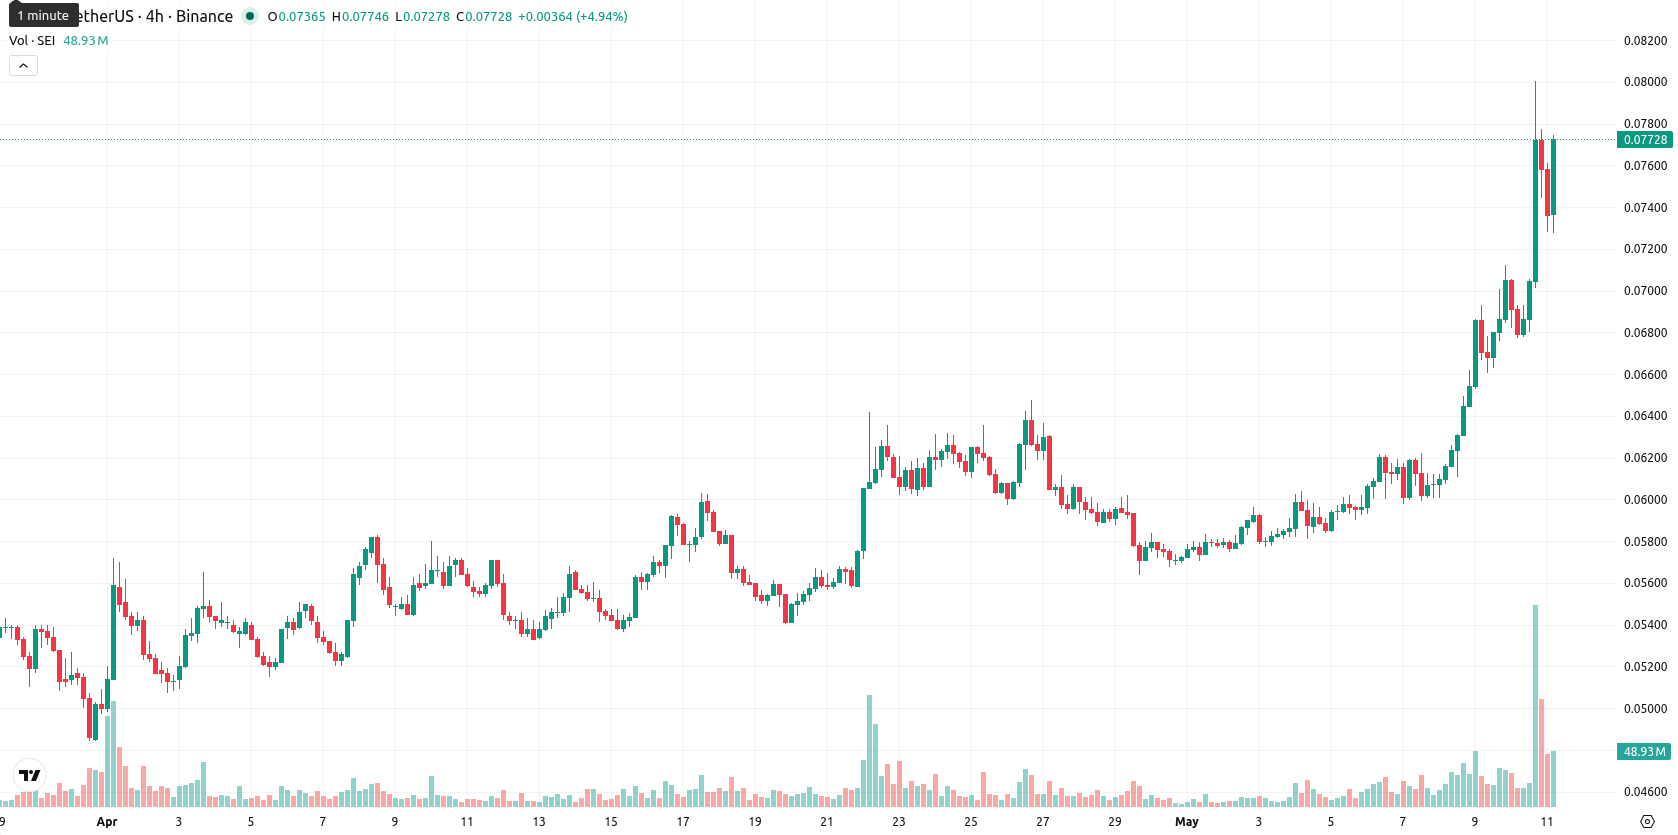
Sei (SEI) is trading at $0.0771, up 12.68% on the day and showing strong upward momentum. The asset currently sits above its key moving averages.
 0.0457
0.0478
0.0457
0.0478
Highlights
- SEI shows strong bullish momentum in both short- and medium-term trading, but long-term resistance remains overhead.
- Technical indicators signal overbought conditions and buyer dominance, pointing to elevated risk of a near-term pullback.
- Expected trading range over the next week is $0.0758 to $0.0858, with downside more likely barring a breakout above $0.0858.
Bullish momentum prevails as SEI nears resistance and overbought levels
SEI is trading well above its MA-20 ($0.0614) and MA-50 ($0.0579), while remaining below the MA-200 ($0.1008). The Ichimoku Kijun on the D1 chart is at $0.0667 and currently acts as immediate support. Momentum indicators confirm bullish trend strength on the daily timeframe: MACD and ADX both support positive trend continuation, while RSI at 77.7 and CCI at 340 reflect overbought conditions. Stoch RSI is at its maximum, suggesting a possible pause or correction, and Bull/Bear Power (BBP) indicates buyer dominance. The Awesome Oscillator aligns with the ongoing upward movement, and price remains near today’s highs following a gap up at the open, with high intraday volatility.
Sideways consolidation likely as upside risk capped by resistance
Over the next five trading days, SEI is expected to trade within the $0.0758–$0.0858 range, with the current price near the lower end of this volatility band relative to current levels. The likelihood of a further price increase is estimated at less than 20%, making a downside move toward support at $0.0758 more probable. The baseline scenario anticipates SEI consolidating sideways within the weekly range; a sustained break above $0.0858 would indicate a bullish scenario, while a decline may test support near $0.0758. Medium-term indicators remain positive, but caution is advised at these elevated levels due to persistent long-term resistance and potential short-term exhaustion.
Earlier, analysts noted that despite recent upward momentum Sei (SEI) remained constrained by longer-term resistance and faced the potential for near-term consolidation. The latest technical signals reinforce this outlook, with overbought conditions and volatility suggesting traders should closely monitor $0.0758 as a critical support in the days ahead.








-
 Afghanistan
-
 Albania
-
 Algeria
-
 Angola
-
 Argentina
-
 Armenia
-
 Australia
-
 Austria
-
 Azerbaijan
-
 Bahamas
-
 Bahrain
-
 Bangladesh
-
 Belarus
-
 Belgium
-
 Bolivia
-
 Botswana
-
 Brazil
-
 Brunei
-
 Bulgaria
-
 Cambodia
-
 Cameroon
-
 Canada
-
 Chile
Chile
-
 China
China
-
 Colombia
-
 Congo
Congo
-
 Costa Rica
-
 Cote d'Ivoire
-
 Croatia
-
 Cuba
Cuba
-
 Cyprus
-
 Czechia
-
 DR Congo
-
 Denmark
-
 Dominican Republic
-
 Ecuador
-
 Egypt
Egypt
-
 El Salvador
-
 Estonia
-
 Eswatini
-
 Ethiopia
-
 Finland
-
 France
-
 Georgia
-
 Germany
-
 Ghana
Ghana
-
 Greece
-
 Haiti
Haiti
-
 Hong Kong
-
 Hungary
-
 India
India
-
 Indonesia
-
 Iran, Islamic republic
-
 Iraq
Iraq
-
 Ireland
-
 Israel
-
 Italy
Italy
-
 Jamaica
-
 Japan
Japan
-
 Jordan
-
 Kazakhstan
-
 Kenya
Kenya
-
 Korea
Korea
-
 Kuwait
-
 Kyrgyzstan
-
 Laos
Laos
-
 Latvia
-
 Lebanon
-
 Lesotho
-
 Libya
Libya
-
 Lithuania
-
 Luxembourg
-
 Madagascar
-
 Malaysia
-
 Malta
Malta
-
 Mauritius
-
 Mexico
-
 Moldova
-
 Mongolia
-
 Montenegro
-
 Morocco
-
 Mozambique
-
 Myanmar
-
 Namibia
-
 Nepal
Nepal
-
 Netherlands
-
 New Zealand
-
 Nigeria
-
 North Macedonia
-
 Norway
-
 Oman
Oman
-
 Pakistan
-
 Palestine
-
 Panama
-
 Papua New Guinea
-
 Paraguay
-
 Peru
Peru
-
 Philippines
-
 Poland
-
 Portugal
-
 Puerto Rico
-
 Qatar
Qatar
-
 Reunion
-
 Romania
-
 Rwanda
-
 Saudi Arabia
-
 Serbia
-
 Singapore
-
 Slovakia
-
 Slovenia
-
 Somalia
-
 South Africa
-
 Spain
Spain
-
 Sri Lanka
-
 Sweden
-
 Switzerland
-
 Syria
Syria
-
 Taiwan
-
 Tajikistan
-
 Tanzania
-
 Thailand
-
 Trinidad and Tobago
-
 Tunisia
-
 Turkey
-
 UAE
UAE
-
 Uganda
-
 Ukraine
-
 United Kingdom
-
United States
-
 Uruguay
-
 Uzbekistan
-
 Venezuela
-
 Vietnam
-
 Yemen
Yemen
-
 Zambia
-
 Zimbabwe
- Forex
- Crypto












