
DASH slides slightly facing resistance at $51: weekly report

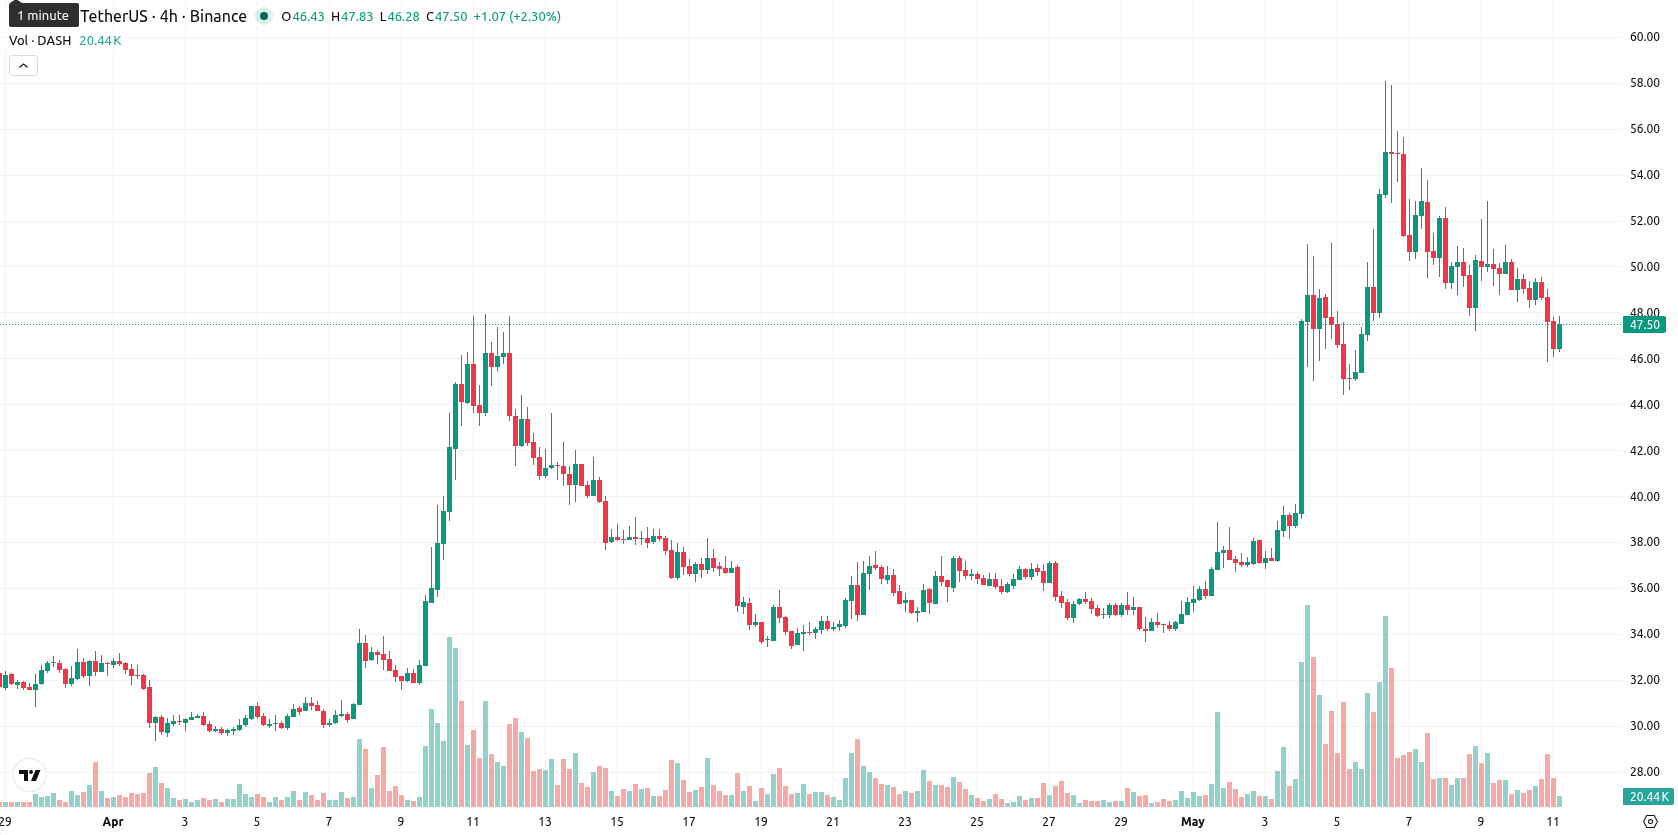
Dash (DASH) is currently trading at $47.43 after falling $0.47 (0.86%) over the past week, closing in the lower part of its weekly range. The asset remains positioned well above its weekly MA-20 ($40.14), MA-50 ($37.49), and MA-200 ($35.94), indicating a medium- and long-term bullish structure despite recent weakness.
Highlights
- DASH trades with a bullish medium- and long-term structure, holding well above dynamic support despite recent pullback.
- Momentum indicators flash mixed signals, with overbought readings and waning short-term strength after a $0.47 weekly decline.
- Expected price action will consolidate between $43.23 and $50.91, with a 75% probability of upward movement over the next week.
Conflicting technical signals as overbought readings clash with trend
On the weekly chart, Dash continues to hold comfortably above all key moving averages, with dynamic support in the $37.49 – $40.14 range. Weekly resistance stands near $51, while support is clustered between $43.23 and $40.14. Weekly RSI and Stochastic RSI are in overbought territory, and the CCI also remains elevated, signaling potential exhaustion at current levels. The MACD currently prints a Strong Sell, while the ADX remains in Buy mode, highlighting conflicting signals as volatility for the week sits at 30.83%.
Sideways bias expected as overbought risk tempers bullish outlook
Over the next 7 days, Dash is expected to consolidate between $43.23 and $50.91, with a 75% probability of upward movement according to the majority of trend indicators. The baseline scenario favors sideways action, as buying interest is offset by overbought signals. A bullish scenario could see the price break above $51 and advance toward the upper band if momentum improves, while a bearish outcome would be triggered if Dash slips under $43, with downside limited by recent volatility and support from moving averages.
Earlier, analysts noted that Dash's bullish momentum was beginning to show signs of exhaustion amid reduced network activity and persistent volatility. The latest weekly analysis confirms that while the long-term structure remains constructive, traders should watch for a potential shift if support near $43 breaks, as conflicting signals and overbought conditions could exacerbate short-term downside risk.


-
 Afghanistan
-
 Albania
-
 Algeria
-
 Angola
-
 Argentina
-
 Armenia
-
 Australia
-
 Austria
-
 Azerbaijan
-
 Bahamas
-
 Bahrain
-
 Bangladesh
-
 Belarus
-
 Belgium
-
 Bolivia
-
 Botswana
-
 Brazil
-
 Brunei
-
 Bulgaria
-
 Cambodia
-
 Cameroon
-
 Canada
-
 Chile
Chile
-
 China
China
-
 Colombia
-
 Congo
Congo
-
 Costa Rica
-
 Cote d'Ivoire
-
 Croatia
-
 Cuba
Cuba
-
 Cyprus
-
 Czechia
-
 DR Congo
-
 Denmark
-
 Dominican Republic
-
 Ecuador
-
 Egypt
Egypt
-
 El Salvador
-
 Estonia
-
 Eswatini
-
 Ethiopia
-
 Finland
-
 France
-
 Georgia
-
 Germany
-
 Ghana
Ghana
-
 Greece
-
 Haiti
Haiti
-
 Hong Kong
-
 Hungary
-
 India
India
-
 Indonesia
-
 Iran, Islamic republic
-
 Iraq
Iraq
-
 Ireland
-
 Israel
-
 Italy
Italy
-
 Jamaica
-
 Japan
Japan
-
 Jordan
-
 Kazakhstan
-
 Kenya
Kenya
-
 Korea
Korea
-
 Kuwait
-
 Kyrgyzstan
-
 Laos
Laos
-
 Latvia
-
 Lebanon
-
 Lesotho
-
 Libya
Libya
-
 Lithuania
-
 Luxembourg
-
 Madagascar
-
 Malaysia
-
 Malta
Malta
-
 Mauritius
-
 Mexico
-
 Moldova
-
 Mongolia
-
 Montenegro
-
 Morocco
-
 Mozambique
-
 Myanmar
-
 Namibia
-
 Nepal
Nepal
-
 Netherlands
-
 New Zealand
-
 Nigeria
-
 North Macedonia
-
 Norway
-
 Oman
Oman
-
 Pakistan
-
 Palestine
-
 Panama
-
 Papua New Guinea
-
 Paraguay
-
 Peru
Peru
-
 Philippines
-
 Poland
-
 Portugal
-
 Puerto Rico
-
 Qatar
Qatar
-
 Reunion
-
 Romania
-
 Rwanda
-
 Saudi Arabia
-
 Serbia
-
 Singapore
-
 Slovakia
-
 Slovenia
-
 Somalia
-
 South Africa
-
 Spain
Spain
-
 Sri Lanka
-
 Sweden
-
 Switzerland
-
 Syria
Syria
-
 Taiwan
-
 Tajikistan
-
 Tanzania
-
 Thailand
-
 Trinidad and Tobago
-
 Tunisia
-
 Turkey
-
 UAE
UAE
-
 Uganda
-
 Ukraine
-
 United Kingdom
-
United States
-
 Uruguay
-
 Uzbekistan
-
 Venezuela
-
 Vietnam
-
 Yemen
Yemen
-
 Zambia
-
 Zimbabwe
- Forex
- Crypto
