
Overbought signals limit upside, pulling Dash lower near $45.68 mark

Dash (DASH) is trading at $46.60, marking a daily decline of 7.19%. The current price is positioned above its key short- and medium-term moving averages, while slightly trailing its longer-term average.
 190.27
194.50
190.27
194.50
Highlights
- Dash network volume remains below average, causing reduced liquidity and limiting new buyer participation in the market.
- Sustained selling pressure and deteriorating technical structure have weakened bullish momentum in recent trading sessions.
- Technicals indicate mixed momentum with overbought signals, forecasting DASH to trade between $42.00 and $51.50 over the next five days.
Lower network volume intensifies selling amid weakening structure
Volume on the Dash network has been lower than average, accompanied by signs of weakening technical structure. This has effectively reduced liquidity and limited buyer engagement, contributing to diminished bullish momentum. As a result, adverse market conditions have been accompanied by continued selling pressure.
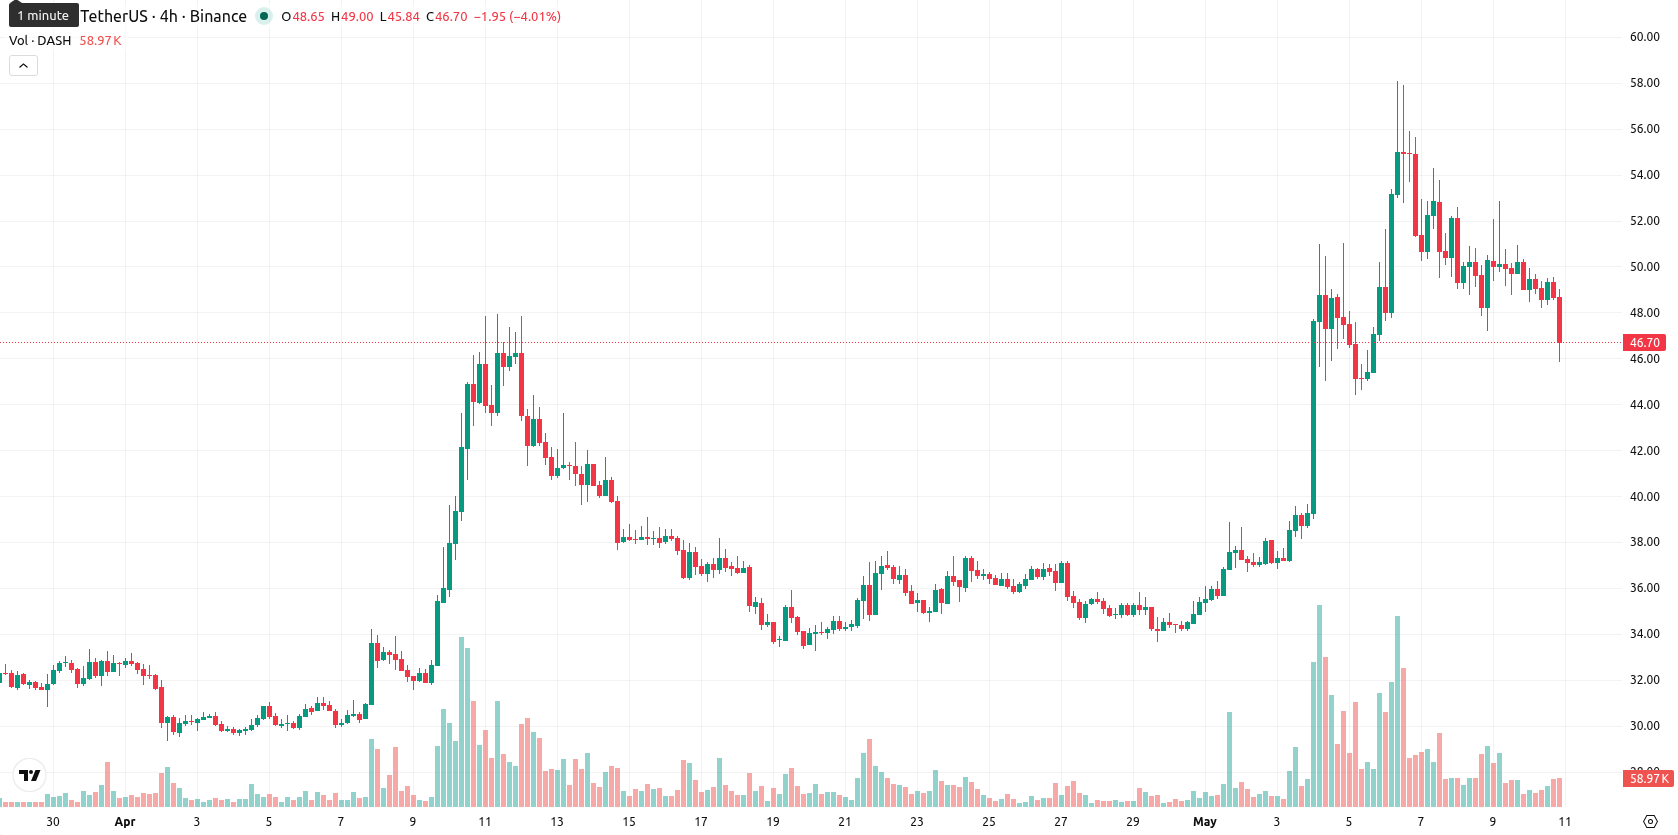
Resistance capped by SMA-200 as momentum signals split
On the daily chart, DASH is trading above the SMA-20 at $40.29 and SMA-50 at $36.83, while remaining just below the SMA-200 at $46.89. The Ichimoku Kijun is situated at $45.68, serving as immediate support beneath the current price. Momentum indicators present a mixed outlook: MACD is signaling a buy condition and the ADX indicates a strengthening trend, but RSI is elevated at 69, CCI lies in the overbought region, and BBP also indicates overbought conditions. The Stoch RSI reads neutral. Price action has been volatile, with today’s session opening at $49.02 and now sitting near today’s low.
Sideways drift projected as upside hinges on renewed buying
Over the next five trading days, DASH is projected to fluctuate within a volatility band spanning $42.00 to $51.50 relative to current levels. The probability of a near-term upward move is estimated at 75%, with declines less probable. The baseline scenario points to price moving sideways within this band. Should buying interest return above $47.00–$48.00, a push toward resistance at $51.50 is possible, while a drop below the $45.68 Kijun level may trigger a test of support at $42.00.
Earlier, analysts noted that Dash was exhibiting strong bullish momentum but warned of heightened volatility and overbought signals. The latest shift to lower volume and fading buyer engagement indicates a change in tone, making the $45.68 Kijun support a pivotal level to monitor for signs of sustained trend reversal or deeper correction.








-
 Afghanistan
-
 Albania
-
 Algeria
-
 Angola
-
 Argentina
-
 Armenia
-
 Australia
-
 Austria
-
 Azerbaijan
-
 Bahamas
-
 Bahrain
-
 Bangladesh
-
 Belarus
-
 Belgium
-
 Bolivia
-
 Botswana
-
 Brazil
-
 Brunei
-
 Bulgaria
-
 Cambodia
-
 Cameroon
-
 Canada
-
 Chile
Chile
-
 China
China
-
 Colombia
-
 Congo
Congo
-
 Costa Rica
-
 Cote d'Ivoire
-
 Croatia
-
 Cuba
Cuba
-
 Cyprus
-
 Czechia
-
 DR Congo
-
 Denmark
-
 Dominican Republic
-
 Ecuador
-
 Egypt
Egypt
-
 El Salvador
-
 Estonia
-
 Eswatini
-
 Ethiopia
-
 Finland
-
 France
-
 Georgia
-
 Germany
-
 Ghana
Ghana
-
 Greece
-
 Haiti
Haiti
-
 Hong Kong
-
 Hungary
-
 India
India
-
 Indonesia
-
 Iran, Islamic republic
-
 Iraq
Iraq
-
 Ireland
-
 Israel
-
 Italy
Italy
-
 Jamaica
-
 Japan
Japan
-
 Jordan
-
 Kazakhstan
-
 Kenya
Kenya
-
 Korea
Korea
-
 Kuwait
-
 Kyrgyzstan
-
 Laos
Laos
-
 Latvia
-
 Lebanon
-
 Lesotho
-
 Libya
Libya
-
 Lithuania
-
 Luxembourg
-
 Madagascar
-
 Malaysia
-
 Malta
Malta
-
 Mauritius
-
 Mexico
-
 Moldova
-
 Mongolia
-
 Montenegro
-
 Morocco
-
 Mozambique
-
 Myanmar
-
 Namibia
-
 Nepal
Nepal
-
 Netherlands
-
 New Zealand
-
 Nigeria
-
 North Macedonia
-
 Norway
-
 Oman
Oman
-
 Pakistan
-
 Palestine
-
 Panama
-
 Papua New Guinea
-
 Paraguay
-
 Peru
Peru
-
 Philippines
-
 Poland
-
 Portugal
-
 Puerto Rico
-
 Qatar
Qatar
-
 Reunion
-
 Romania
-
 Rwanda
-
 Saudi Arabia
-
 Serbia
-
 Singapore
-
 Slovakia
-
 Slovenia
-
 Somalia
-
 South Africa
-
 Spain
Spain
-
 Sri Lanka
-
 Sweden
-
 Switzerland
-
 Syria
Syria
-
 Taiwan
-
 Tajikistan
-
 Tanzania
-
 Thailand
-
 Trinidad and Tobago
-
 Tunisia
-
 Turkey
-
 UAE
UAE
-
 Uganda
-
 Ukraine
-
 United Kingdom
-
United States
-
 Uruguay
-
 Uzbekistan
-
 Venezuela
-
 Vietnam
-
 Yemen
Yemen
-
 Zambia
-
 Zimbabwe
- Forex
- Crypto











