
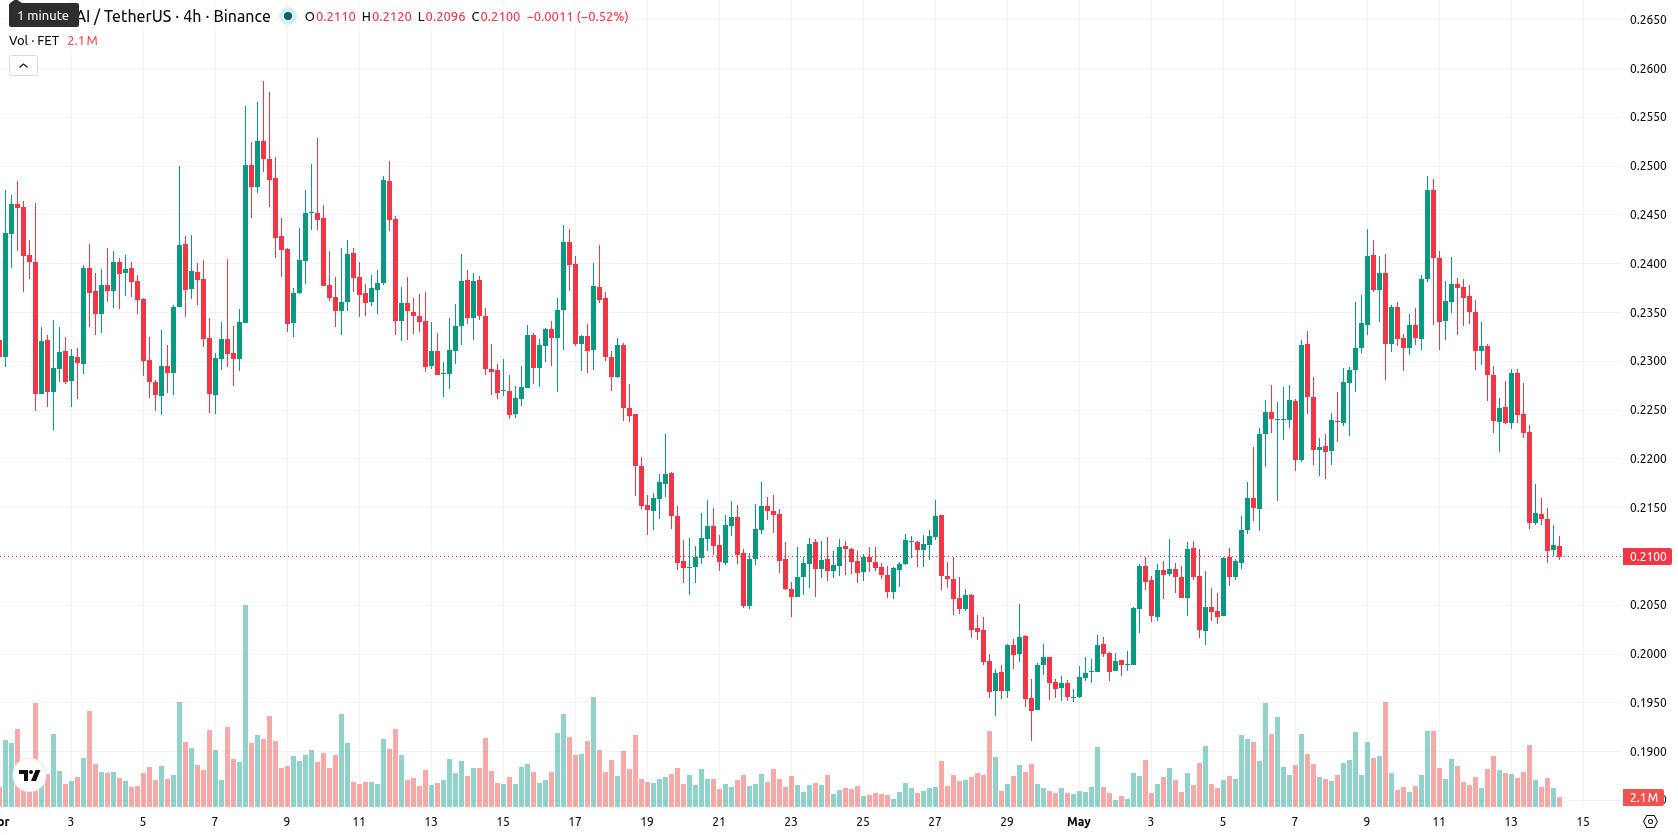
Fetch.ai price prediction: Will $0.2090 support hold as FET loses 7.19%?

Fetch.ai (FET) is trading at $0.2104 after a daily drop of 7.19%. The price currently sits below its key moving averages, indicating persistent downward momentum relative to recent trend levels.
Highlights
- FET trades under key short-, medium-, and long-term moving averages, confirming a prevailing bearish trend across all timeframes.
- Price action remains volatile with persistent selling pressure, as the asset drops 7.19% intraday and hovers near session lows.
- FET is expected to consolidate between $0.1955 and $0.2310, with downside risk dominating unless price closes above immediate resistance at $0.2200.
Mixed technical momentum as MACD diverges from neutral indicators
FET is trading below its SMA-20 ($0.2141), SMA-50 ($0.2245), and SMA-200 ($0.2255). The D1 Ichimoku Kijun is positioned at $0.2200, acting as the nearest resistance, and no crossover signals (golden or death cross) have formed. The daily ADX is at 18.87, indicating neutral momentum, while MACD points to a modest buy signal. RSI sits at 47.16 and CCI at 23.77, both reflecting a non-extreme state. BBP shows limited buyer strength on a daily basis; intraday signals remain bearish. No significant gaps occurred at the open, with prices fluctuating between $0.2093 and $0.2149, reflecting high volatility and sustained selling pressure. Divergence between MACD’s modest bullishness and other neutral or bearish indicators is evident, aligning with prevailing downward momentum.
Sideways price action likely as upward scenario faces resistance
Over the next five sessions, FET is expected to trade within a $0.1955 to $0.2310 volatility band relative to current levels. The probability of a sustained upward move is very low, estimated below 20%. The baseline scenario anticipates sideways action between immediate support and resistance; a bullish scenario would require a close above $0.2200, while a breakdown below $0.2090 could trigger a move toward $0.1955.
Earlier, analysts noted that Fetch.ai was exhibiting ongoing short-term weakness while remaining constrained by broader resistance. The latest technical readings reinforce this cautious outlook, with attention now focused on the $0.2200 resistance as a pivotal level that could determine the next directional move.


Latest FET News


-
 Afghanistan
-
 Albania
-
 Algeria
-
 Angola
-
 Argentina
-
 Armenia
-
 Australia
-
 Austria
-
 Azerbaijan
-
 Bahamas
-
 Bahrain
-
 Bangladesh
-
 Belarus
-
 Belgium
-
 Bolivia
-
 Botswana
-
 Brazil
-
 Brunei
-
 Bulgaria
-
 Cambodia
-
 Cameroon
-
 Canada
-
 Chile
Chile
-
 China
China
-
 Colombia
-
 Congo
Congo
-
 Costa Rica
-
 Cote d'Ivoire
-
 Croatia
-
 Cuba
Cuba
-
 Cyprus
-
 Czechia
-
 DR Congo
-
 Denmark
-
 Dominican Republic
-
 Ecuador
-
 Egypt
Egypt
-
 El Salvador
-
 Estonia
-
 Eswatini
-
 Ethiopia
-
 Finland
-
 France
-
 Georgia
-
 Germany
-
 Ghana
Ghana
-
 Greece
-
 Haiti
Haiti
-
 Hong Kong
-
 Hungary
-
 India
India
-
 Indonesia
-
 Iran, Islamic republic
-
 Iraq
Iraq
-
 Ireland
-
 Israel
-
 Italy
Italy
-
 Jamaica
-
 Japan
Japan
-
 Jordan
-
 Kazakhstan
-
 Kenya
Kenya
-
 Korea
Korea
-
 Kuwait
-
 Kyrgyzstan
-
 Laos
Laos
-
 Latvia
-
 Lebanon
-
 Lesotho
-
 Libya
Libya
-
 Lithuania
-
 Luxembourg
-
 Madagascar
-
 Malaysia
-
 Malta
Malta
-
 Mauritius
-
 Mexico
-
 Moldova
-
 Mongolia
-
 Montenegro
-
 Morocco
-
 Mozambique
-
 Myanmar
-
 Namibia
-
 Nepal
Nepal
-
 Netherlands
-
 New Zealand
-
 Nigeria
-
 North Macedonia
-
 Norway
-
 Oman
Oman
-
 Pakistan
-
 Palestine
-
 Panama
-
 Papua New Guinea
-
 Paraguay
-
 Peru
Peru
-
 Philippines
-
 Poland
-
 Portugal
-
 Puerto Rico
-
 Qatar
Qatar
-
 Reunion
-
 Romania
-
 Rwanda
-
 Saudi Arabia
-
 Serbia
-
 Singapore
-
 Slovakia
-
 Slovenia
-
 Somalia
-
 South Africa
-
 Spain
Spain
-
 Sri Lanka
-
 Sweden
-
 Switzerland
-
 Syria
Syria
-
 Taiwan
-
 Tajikistan
-
 Tanzania
-
 Thailand
-
 Trinidad and Tobago
-
 Tunisia
-
 Turkey
-
 UAE
UAE
-
 Uganda
-
 Ukraine
-
 United Kingdom
-
United States
-
 Uruguay
-
 Uzbekistan
-
 Venezuela
-
 Vietnam
-
 Yemen
Yemen
-
 Zambia
-
 Zimbabwe
- Forex
- Crypto
