
-7.04% for Fetch.ai as long-term holders unwind positions

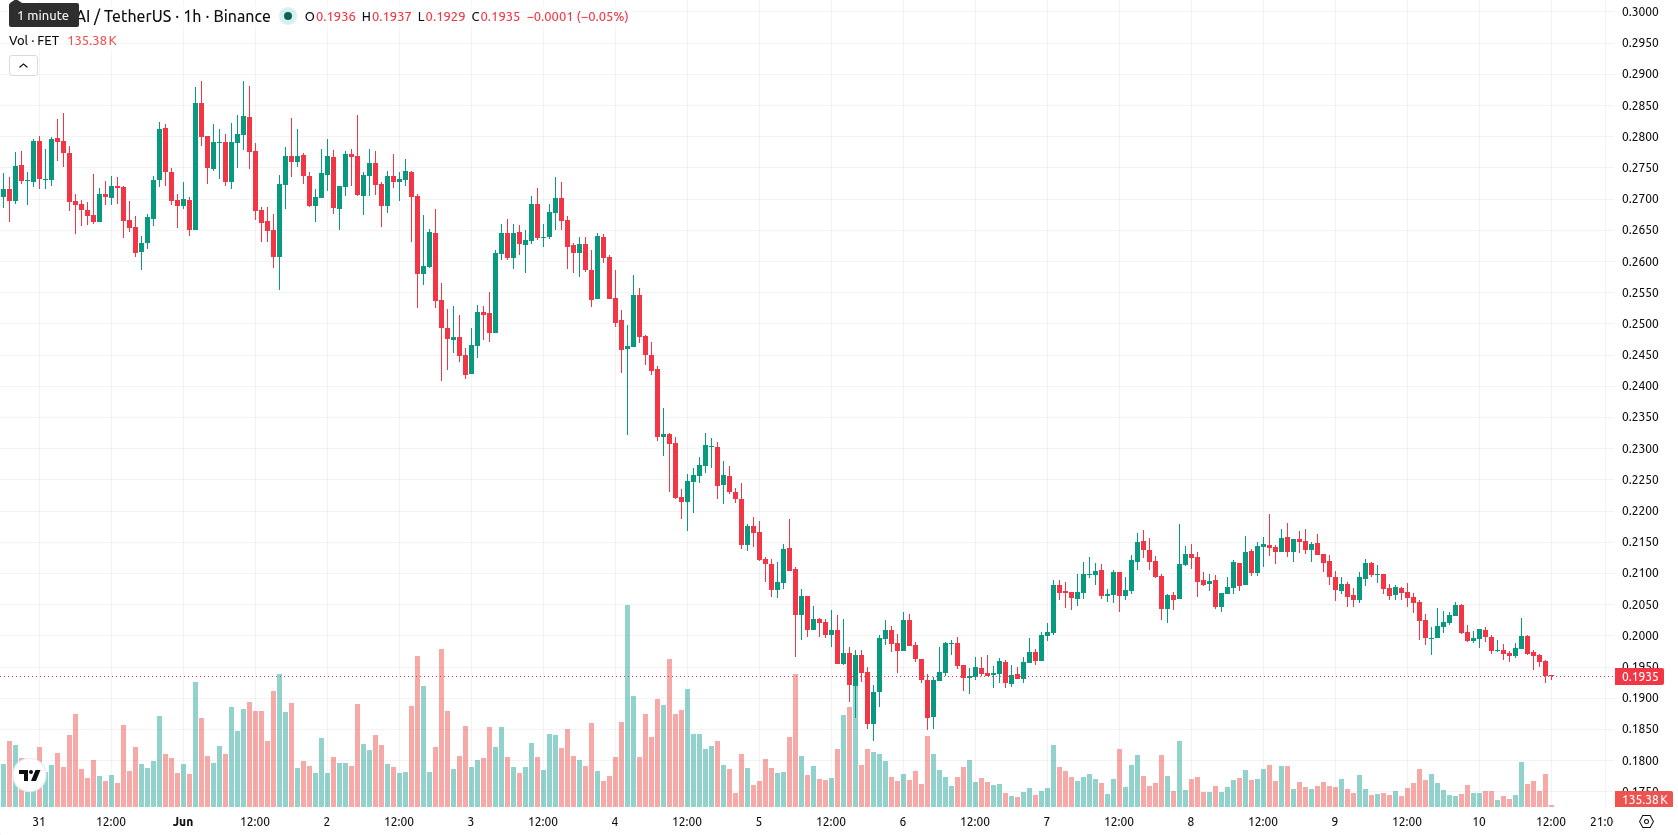
Fetch.ai (FET) is trading at $0.1929, reflecting a 7.04% daily decline. The asset is currently below its key moving averages, positioning near the session's low in a high-volatility environment.
Highlights
- Fetch.ai's market cap has dropped sharply to $444.6 million, reflecting substantial investor capital outflows since its March 2024 high.
- Declining active addresses and transaction volumes signal fading network usage and diminished demand for the FET token.
- FET/USD trades below key moving averages, with bearish momentum dominating and a near-term range of $0.1652–$0.2098 expected amid high volatility.
Elevated selling pressure as investor exits and network decline deepen
Fetch.ai's market capitalization has declined to $444.6 million, placing it well below the March 2024 all-time high and reflecting a substantial withdrawal of investor capital from the token. On-chain data also reported a decrease in active addresses and transaction volumes, signaling diminished network participation and lower demand for blockchain usage. Additionally, many long-term holders have reduced their positions, which has increased the available float and may have contributed to downward selling pressure.
Sustained bearish momentum as FET loses key technical supports
FET is currently trading below the MA-20 ($0.1992), MA-50 ($0.2057), and MA-200 ($0.2172) on the hourly chart, indicating persistent downside alignment across short, medium, and long-term periods. The Ichimoku Kijun level is set at $0.2004 and serves as immediate resistance, while the expected support approaches $0.1652. MACD continues to signal sell momentum, whereas ADX remains neutral, pointing to a lack of strong intraday trend. Momentum indicators show RSI at 32.29 (sell signal), with Stoch RSI and CCI both in oversold territory, and BBP reinforcing seller dominance; the Awesome Oscillator is neutral with no clear trend indication. These technical readings highlight sustained bearish momentum, though short-term exhaustion is developing.
Downside risk persists as weak technicals constrain upside scenarios
Over the next 2–3 days, FET is projected to trade within a typical volatility band of $0.1652 to $0.2098. There is a very low probability of an upward move, and further downside remains likely given prevailing technical weakness. If resistance at $0.2004 (Kijun) is broken, short covering could accelerate and temporarily lift the price. Conversely, a breakdown below $0.1652 support may prompt intensified selling and open the possibility for new lows.
Earlier, analysts noted that persistent selling pressure and weak momentum continued to weigh on Fetch.ai, limiting the potential for a sustained recovery. The current decline in both market capitalization and on-chain activity reinforces the bearish outlook, making the forthcoming reaction at the $0.2004 resistance level a key focus for traders evaluating a possible shift in short-term sentiment.


Latest FET News


-
 Afghanistan
-
 Albania
-
 Algeria
-
 Angola
-
 Argentina
-
 Armenia
-
 Australia
-
 Austria
-
 Azerbaijan
-
 Bahamas
-
 Bahrain
-
 Bangladesh
-
 Belarus
-
 Belgium
-
 Bolivia
-
 Botswana
-
 Brazil
-
 Brunei
-
 Bulgaria
-
 Cambodia
-
 Cameroon
-
 Canada
-
 Chile
Chile
-
 China
China
-
 Colombia
-
 Congo
Congo
-
 Costa Rica
-
 Cote d'Ivoire
-
 Croatia
-
 Cuba
Cuba
-
 Cyprus
-
 Czechia
-
 DR Congo
-
 Denmark
-
 Dominican Republic
-
 Ecuador
-
 Egypt
Egypt
-
 El Salvador
-
 Estonia
-
 Eswatini
-
 Ethiopia
-
 Finland
-
 France
-
 Georgia
-
 Germany
-
 Ghana
Ghana
-
 Greece
-
 Haiti
Haiti
-
 Hong Kong
-
 Hungary
-
 India
India
-
 Indonesia
-
 Iran, Islamic republic
-
 Iraq
Iraq
-
 Ireland
-
 Israel
-
 Italy
Italy
-
 Jamaica
-
 Japan
Japan
-
 Jordan
-
 Kazakhstan
-
 Kenya
Kenya
-
 Korea
Korea
-
 Kuwait
-
 Kyrgyzstan
-
 Laos
Laos
-
 Latvia
-
 Lebanon
-
 Lesotho
-
 Libya
Libya
-
 Lithuania
-
 Luxembourg
-
 Madagascar
-
 Malaysia
-
 Malta
Malta
-
 Mauritius
-
 Mexico
-
 Moldova
-
 Mongolia
-
 Montenegro
-
 Morocco
-
 Mozambique
-
 Myanmar
-
 Namibia
-
 Nepal
Nepal
-
 Netherlands
-
 New Zealand
-
 Nigeria
-
 North Macedonia
-
 Norway
-
 Oman
Oman
-
 Pakistan
-
 Palestine
-
 Panama
-
 Papua New Guinea
-
 Paraguay
-
 Peru
Peru
-
 Philippines
-
 Poland
-
 Portugal
-
 Puerto Rico
-
 Qatar
Qatar
-
 Reunion
-
 Romania
-
 Rwanda
-
 Saudi Arabia
-
 Serbia
-
 Singapore
-
 Slovakia
-
 Slovenia
-
 Somalia
-
 South Africa
-
 Spain
Spain
-
 Sri Lanka
-
 Sweden
-
 Switzerland
-
 Syria
Syria
-
 Taiwan
-
 Tajikistan
-
 Tanzania
-
 Thailand
-
 Trinidad and Tobago
-
 Tunisia
-
 Turkey
-
 UAE
UAE
-
 Uganda
-
 Ukraine
-
 United Kingdom
-
United States
-
 Uruguay
-
 Uzbekistan
-
 Venezuela
-
 Vietnam
-
 Yemen
Yemen
-
 Zambia
-
 Zimbabwe
- Forex
- Crypto
