

XLM ticks up with upside capped by MA-20 resistance at $0.1737: weekly review

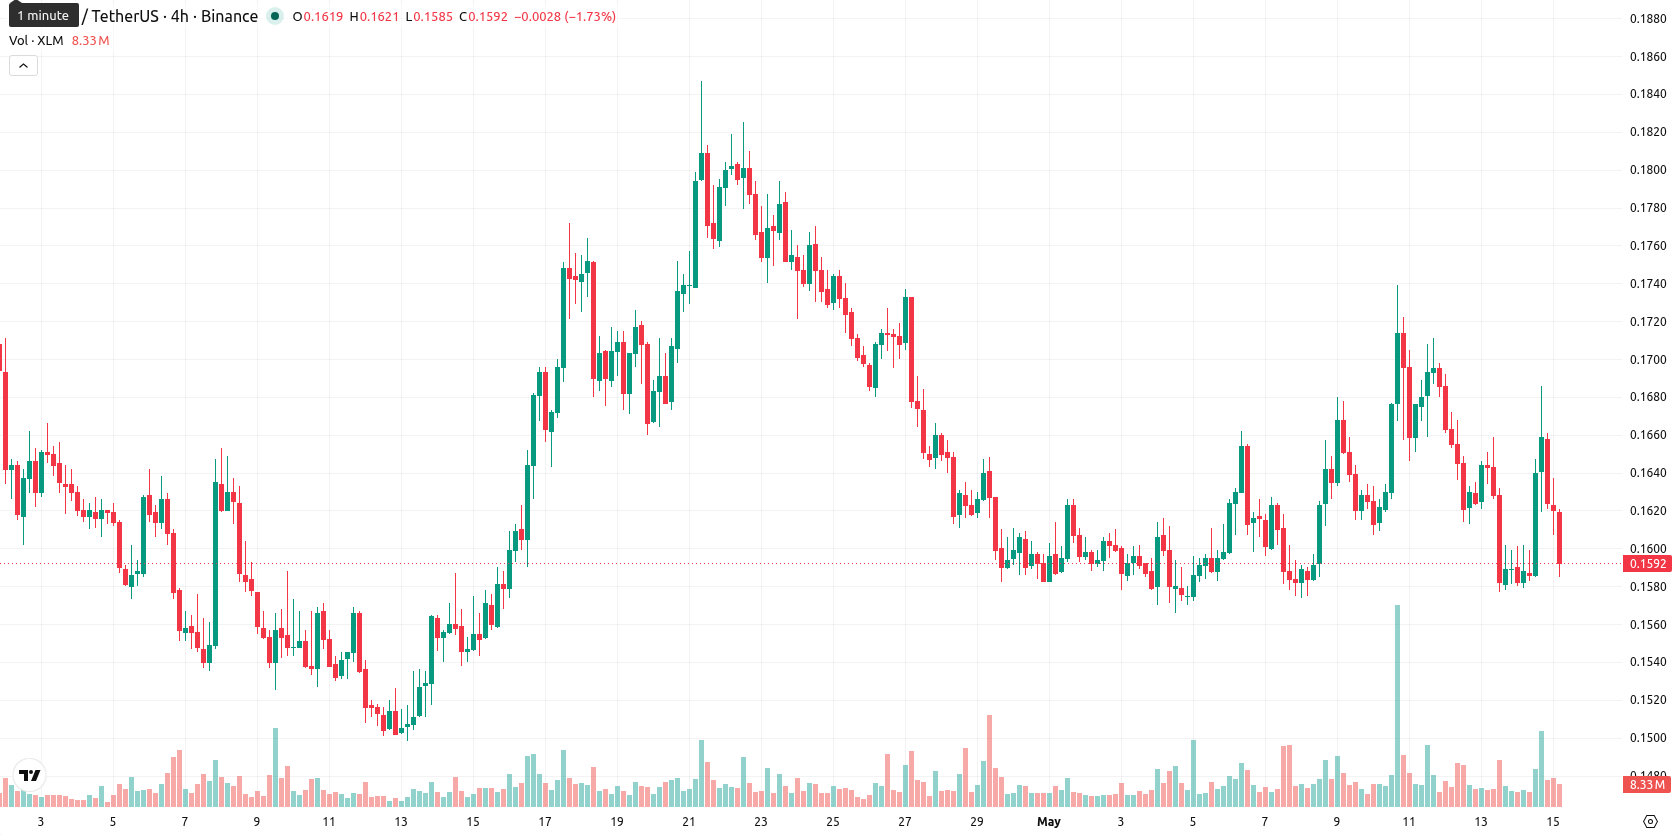
Stellar (XLM) is currently trading at $0.1588, positioned below its weekly MA-20 ($0.1737), MA-50 ($0.2651), and MA-200 ($0.1797), indicating sustained selling pressure across both medium- and long-term timeframes. Over the past week, XLM rose by $0.0005 (0.46%), but the asset remains at the bottom of its weekly range, reflecting ongoing weakness despite a modest advance.
 0.1922
0.2061
0.1922
0.2061
Highlights
- XLM remains under sustained selling pressure, trading below key moving averages on both medium- and long-term timeframes.
- Momentum indicators are broadly negative, with signals for both trend and volatility suggesting a fragile bearish environment.
- XLM is expected to trade within a $0.1430 to $0.1748 range over the next week, with downside risk dominating.
Bermuda partnership lifts sentiment as onchain adoption efforts expand
The Stellar Development Foundation announced a major partnership with the government of Bermuda to support the nation’s transition to a fully onchain economy using the Stellar network. As part of this effort, Bermuda residents will gain access to onchain wage payments, digital merchant transactions, and government fee settlements through Stellar-compatible wallets. The collaboration also sets the stage for pilots in stablecoin payments, new tokenization tools for institutions, and expanded digital literacy initiatives on the island.
Bearish momentum persists this week as technical signals diverge at support
Weekly technical analysis highlights continued downside risks for XLM, as the asset consolidates near support with volatility at 10.27%. Momentum indicators on the weekly chart remain largely bearish, including the MACD and ADX both in sell mode and the RSI signaling a negative bias. The price is pinned below all critical weekly moving averages, with the closest notable resistance at the MA-20 ($0.1737), while the Ichimoku Kijun remains well above current levels. Despite the Stochastic RSI being overbought and the CCI reading neutral, only the Bull/Bear Power shows tentative buyer interest, creating a divergence from the dominant bearish technical picture.
Sideways bias likely next week as upside breakout faces weak momentum
For the next 7 days, XLM is expected to trade in a range of $0.1430 to $0.1748, with a higher probability of remaining in a sideways corridor due to the lack of bullish momentum on the weekly indicators. Should the price manage a sustained breakout above the MA-20 ($0.1737), a bullish scenario could begin to unfold, but this appears unlikely given current technical conditions. Conversely, a break below $0.1430 would likely trigger further downside, in line with prevailing weekly pressure.
Earlier, analysts noted that Stellar remained under persistent bearish pressure, with technical data and derivatives market sentiment favoring downside risks. Recent developments, including the Bermuda partnership, add a potentially positive long-term catalyst; however, traders should closely monitor the $0.1430 support level as prevailing technicals suggest the risk of further declines if this threshold fails.










-
 Afghanistan
-
 Albania
-
 Algeria
-
 Angola
-
 Argentina
-
 Armenia
-
 Australia
-
 Austria
-
 Azerbaijan
-
 Bahamas
-
 Bahrain
-
 Bangladesh
-
 Belarus
-
 Belgium
-
 Bolivia
-
 Botswana
-
 Brazil
-
 Brunei
-
 Bulgaria
-
 Cambodia
-
 Cameroon
-
 Canada
-
 Chile
Chile
-
 China
China
-
 Colombia
-
 Congo
Congo
-
 Costa Rica
-
 Cote d'Ivoire
-
 Croatia
-
 Cuba
Cuba
-
 Cyprus
-
 Czechia
-
 DR Congo
-
 Denmark
-
 Dominican Republic
-
 Ecuador
-
 Egypt
Egypt
-
 El Salvador
-
 Estonia
-
 Eswatini
-
 Ethiopia
-
 Finland
-
 France
-
 Georgia
-
 Germany
-
 Ghana
Ghana
-
 Greece
-
 Haiti
Haiti
-
 Hong Kong
-
 Hungary
-
 India
India
-
 Indonesia
-
 Iran, Islamic republic
-
 Iraq
Iraq
-
 Ireland
-
 Israel
-
 Italy
Italy
-
 Jamaica
-
 Japan
Japan
-
 Jordan
-
 Kazakhstan
-
 Kenya
Kenya
-
 Korea
Korea
-
 Kuwait
-
 Kyrgyzstan
-
 Laos
Laos
-
 Latvia
-
 Lebanon
-
 Lesotho
-
 Libya
Libya
-
 Lithuania
-
 Luxembourg
-
 Madagascar
-
 Malaysia
-
 Malta
Malta
-
 Mauritius
-
 Mexico
-
 Moldova
-
 Mongolia
-
 Montenegro
-
 Morocco
-
 Mozambique
-
 Myanmar
-
 Namibia
-
 Nepal
Nepal
-
 Netherlands
-
 New Zealand
-
 Nigeria
-
 North Macedonia
-
 Norway
-
 Oman
Oman
-
 Pakistan
-
 Palestine
-
 Panama
-
 Papua New Guinea
-
 Paraguay
-
 Peru
Peru
-
 Philippines
-
 Poland
-
 Portugal
-
 Puerto Rico
-
 Qatar
Qatar
-
 Reunion
-
 Romania
-
 Rwanda
-
 Saudi Arabia
-
 Serbia
-
 Singapore
-
 Slovakia
-
 Slovenia
-
 Somalia
-
 South Africa
-
 Spain
Spain
-
 Sri Lanka
-
 Sweden
-
 Switzerland
-
 Syria
Syria
-
 Taiwan
-
 Tajikistan
-
 Tanzania
-
 Thailand
-
 Trinidad and Tobago
-
 Tunisia
-
 Turkey
-
 UAE
UAE
-
 Uganda
-
 Ukraine
-
 United Kingdom
-
United States
-
 Uruguay
-
 Uzbekistan
-
 Venezuela
-
 Vietnam
-
 Yemen
Yemen
-
 Zambia
-
 Zimbabwe
- Forex
- Crypto












