
TRUMP drops 7.11% as price trades well below its long-term average

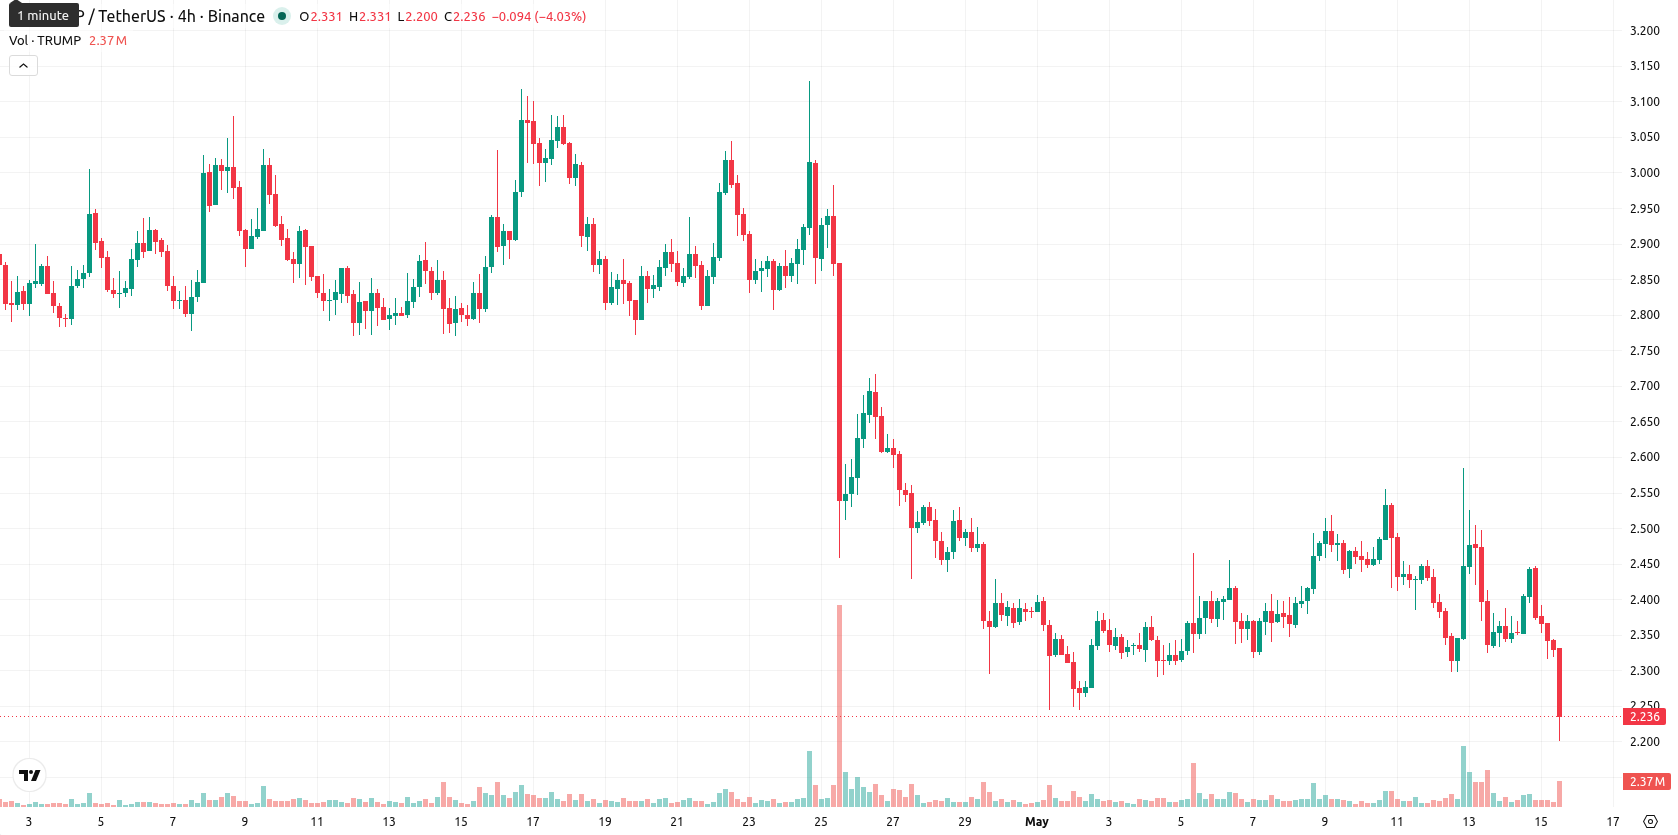
Official Trump (TRUMP) is trading at $2.22 after a sharp 7.11% decline in the latest session. The price is currently positioned well below its key moving averages, highlighting a period of pronounced technical weakness.
 1.57
1.66
1.57
1.66
Highlights
- TRUMP trades below all major moving averages, indicating entrenched bearish momentum across short, medium, and long-term timeframes.
- Momentum indicators confirm strong downside pressure, with sellers dominating despite minor signals for short-term relief rallies.
- Price is expected to consolidate between $2.15 and $2.35 this week, with a high risk of further declines if $2.15 is breached.
Bearish momentum dominates as multiple indicators confirm weakness
The technical configuration shows TRUMP trading below MA-20 ($2.42), MA-50 ($2.71), and MA-200 ($4.45). The Ichimoku Kijun level is at $2.68, acting as immediate resistance. Momentum indicators confirm downside pressure: MACD and ADX both signal strong bearish momentum, with daily RSI at 39.49, indicating a bearish but not oversold condition. Stoch RSI on D1 points to possible short-term relief with some divergence, while CCI is neutral and BBP is marginally positive at 0.01, showing in-session selling remains dominant. The session range is $2.20 to $2.39, with high volatility and no significant opening gap, as sellers pressed the price toward the lower end of the range.
Sideways range expected as rebound odds remain low
Short term, TRUMP is expected to consolidate within a typical volatility band of $2.15 to $2.35, centered on current levels given recent sharp moves. The probability of a sustained rebound remains below 20%, while risks continue to favor further decline. The baseline outlook is for sideways action within this range. A break above $2.68 would trigger a potential bullish reversal, while a drop below $2.15 would likely accelerate the existing downtrend.
Earlier, analysts noted that controversy and political focus around the TRUMP memecoin were complicating efforts to deliver regulatory clarity to the cryptocurrency sector. With technical signals remaining firmly bearish and volatility high, traders should closely monitor the $2.15 support—any sustained breach could intensify downside momentum and shift market dynamics further from stabilization.


Latest TRUMP News







-
 Afghanistan
-
 Albania
-
 Algeria
-
 Angola
-
 Argentina
-
 Armenia
-
 Australia
-
 Austria
-
 Azerbaijan
-
 Bahamas
-
 Bahrain
-
 Bangladesh
-
 Belarus
-
 Belgium
-
 Bolivia
-
 Botswana
-
 Brazil
-
 Brunei
-
 Bulgaria
-
 Cambodia
-
 Cameroon
-
 Canada
-
 Chile
Chile
-
 China
China
-
 Colombia
-
 Congo
Congo
-
 Costa Rica
-
 Cote d'Ivoire
-
 Croatia
-
 Cuba
Cuba
-
 Cyprus
-
 Czechia
-
 DR Congo
-
 Denmark
-
 Dominican Republic
-
 Ecuador
-
 Egypt
Egypt
-
 El Salvador
-
 Estonia
-
 Eswatini
-
 Ethiopia
-
 Finland
-
 France
-
 Georgia
-
 Germany
-
 Ghana
Ghana
-
 Greece
-
 Haiti
Haiti
-
 Hong Kong
-
 Hungary
-
 India
India
-
 Indonesia
-
 Iran, Islamic republic
-
 Iraq
Iraq
-
 Ireland
-
 Israel
-
 Italy
Italy
-
 Jamaica
-
 Japan
Japan
-
 Jordan
-
 Kazakhstan
-
 Kenya
Kenya
-
 Korea
Korea
-
 Kuwait
-
 Kyrgyzstan
-
 Laos
Laos
-
 Latvia
-
 Lebanon
-
 Lesotho
-
 Libya
Libya
-
 Lithuania
-
 Luxembourg
-
 Madagascar
-
 Malaysia
-
 Malta
Malta
-
 Mauritius
-
 Mexico
-
 Moldova
-
 Mongolia
-
 Montenegro
-
 Morocco
-
 Mozambique
-
 Myanmar
-
 Namibia
-
 Nepal
Nepal
-
 Netherlands
-
 New Zealand
-
 Nigeria
-
 North Macedonia
-
 Norway
-
 Oman
Oman
-
 Pakistan
-
 Palestine
-
 Panama
-
 Papua New Guinea
-
 Paraguay
-
 Peru
Peru
-
 Philippines
-
 Poland
-
 Portugal
-
 Puerto Rico
-
 Qatar
Qatar
-
 Reunion
-
 Romania
-
 Rwanda
-
 Saudi Arabia
-
 Serbia
-
 Singapore
-
 Slovakia
-
 Slovenia
-
 Somalia
-
 South Africa
-
 Spain
Spain
-
 Sri Lanka
-
 Sweden
-
 Switzerland
-
 Syria
Syria
-
 Taiwan
-
 Tajikistan
-
 Tanzania
-
 Thailand
-
 Trinidad and Tobago
-
 Tunisia
-
 Turkey
-
 UAE
UAE
-
 Uganda
-
 Ukraine
-
 United Kingdom
-
United States
-
 Uruguay
-
 Uzbekistan
-
 Venezuela
-
 Vietnam
-
 Yemen
Yemen
-
 Zambia
-
 Zimbabwe
- Forex
- Crypto











