
Theta tumbles as sellers press below short-term averages

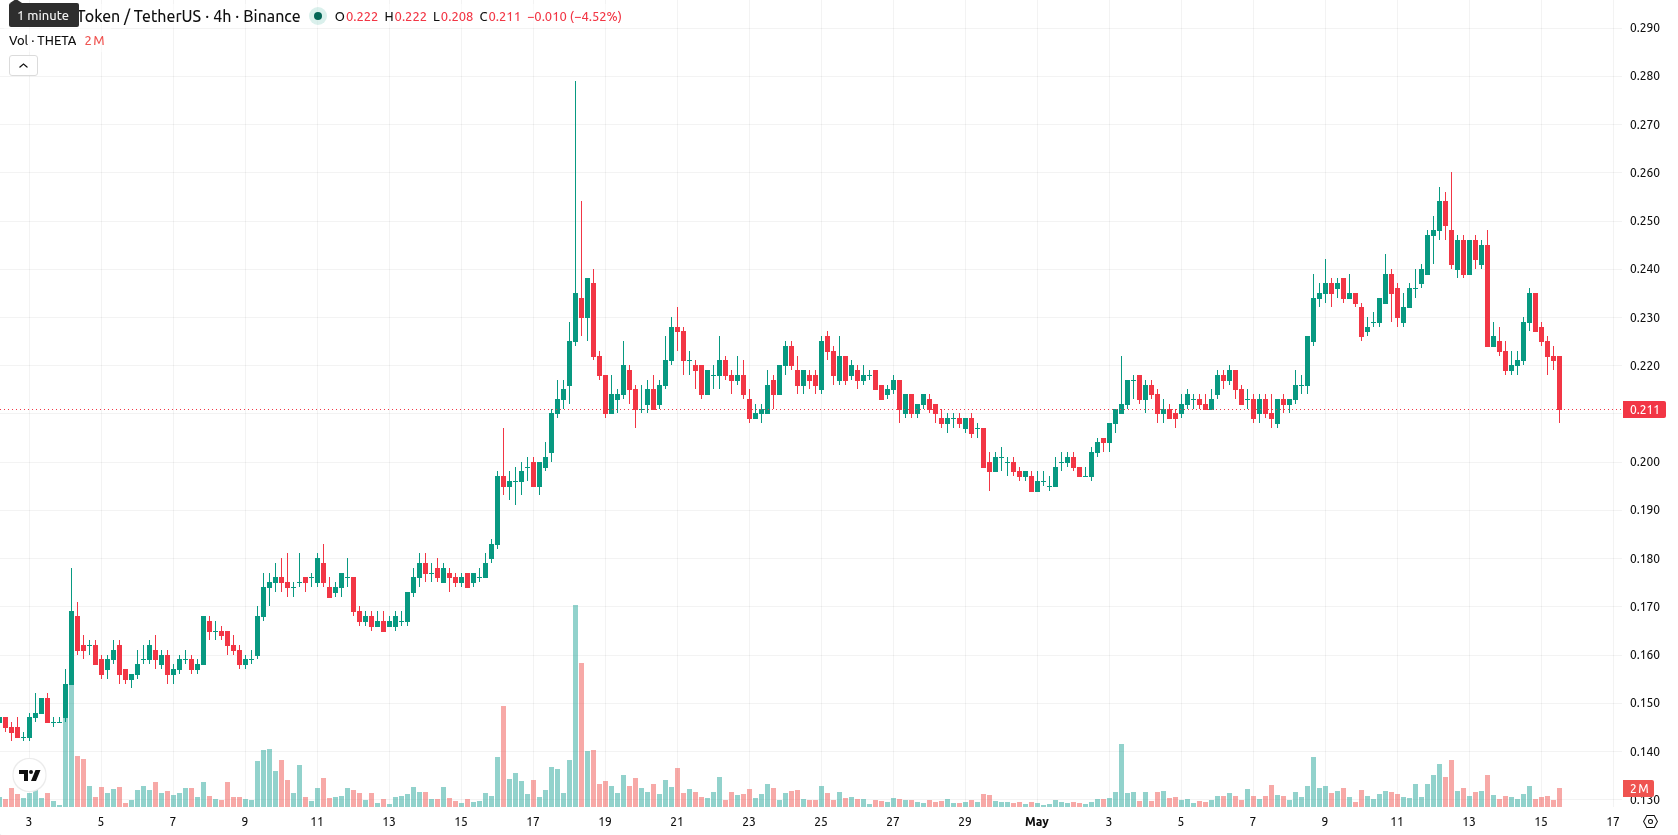
Theta (THETA) is trading at $0.211, marking a daily decline of 8.26%. The price currently sits below its short-term moving averages but holds above important medium-term support levels.
 0.1403
0.1522000
0.1403
0.1522000
Highlights
- THETA faces sustained selling pressure, trading well below long-term resistance with short-term momentum signaling further weakness.
- Technical indicators show mixed signals on the daily chart but lean strongly bearish on weekly timeframes, indicating elevated downside risk.
- Expected trading range for the coming week is $0.190 to $0.232, with less than a 20% probability of a price rebound.
Technical conflict as daily strength meets multi-timeframe selling
The 20-day moving average is at $0.2179, while the 50-day is at $0.19356 and the 200-day at $0.26731. The Ichimoku Kijun line stands at $0.227, presenting immediate resistance. Momentum readings are mixed: the MACD and ADX (daily) indicate bullish activity, but both intraday and longer timeframes favor sellers. RSI and CCI remain in the buy zone on the daily chart, supported by neutral Stoch RSI readings, even as weekly readings point to overbought conditions. The Bull/Bear Power (BBP) measure highlights strong buyer dominance on the daily timeframe, whereas shorter timeframes tilt bearish. The Awesome Oscillator is neutral, offering little confirmation for any sustained trend. Price action is volatile, trading near daily lows, with buyers and sellers alternating control across different timeframes.
Sideways outlook as bearish risks outweigh limited upside
Looking ahead, the typical volatility band for the coming week is expected between $0.190 and $0.232. The probability of a price increase is low (less than 20%), and further downside risk remains elevated, with weekly technical indicators showing persistent bearish momentum. The primary scenario is for THETA to trade sideways within this broad range. Upside potential requires a decisive breakout above $0.227 with sustained buying; a drop below $0.190 would risk new lows as selling pressure accelerates.
Earlier, analysts noted that Theta was experiencing persistent downside risk amid volatile trading and mixed technical momentum. The present analysis reinforces this outlook, underscoring that further losses remain likely unless THETA can reclaim the $0.227 resistance—making this the key level to watch for any shift in market direction.














-
 Afghanistan
-
 Albania
-
 Algeria
-
 Angola
-
 Argentina
-
 Armenia
-
 Australia
-
 Austria
-
 Azerbaijan
-
 Bahamas
-
 Bahrain
-
 Bangladesh
-
 Belarus
-
 Belgium
-
 Bolivia
-
 Botswana
-
 Brazil
-
 Brunei
-
 Bulgaria
-
 Cambodia
-
 Cameroon
-
 Canada
-
 Chile
Chile
-
 China
China
-
 Colombia
-
 Congo
Congo
-
 Costa Rica
-
 Cote d'Ivoire
-
 Croatia
-
 Cuba
Cuba
-
 Cyprus
-
 Czechia
-
 DR Congo
-
 Denmark
-
 Dominican Republic
-
 Ecuador
-
 Egypt
Egypt
-
 El Salvador
-
 Estonia
-
 Eswatini
-
 Ethiopia
-
 Finland
-
 France
-
 Georgia
-
 Germany
-
 Ghana
Ghana
-
 Greece
-
 Haiti
Haiti
-
 Hong Kong
-
 Hungary
-
 India
India
-
 Indonesia
-
 Iran, Islamic republic
-
 Iraq
Iraq
-
 Ireland
-
 Israel
-
 Italy
Italy
-
 Jamaica
-
 Japan
Japan
-
 Jordan
-
 Kazakhstan
-
 Kenya
Kenya
-
 Korea
Korea
-
 Kuwait
-
 Kyrgyzstan
-
 Laos
Laos
-
 Latvia
-
 Lebanon
-
 Lesotho
-
 Libya
Libya
-
 Lithuania
-
 Luxembourg
-
 Madagascar
-
 Malaysia
-
 Malta
Malta
-
 Mauritius
-
 Mexico
-
 Moldova
-
 Mongolia
-
 Montenegro
-
 Morocco
-
 Mozambique
-
 Myanmar
-
 Namibia
-
 Nepal
Nepal
-
 Netherlands
-
 New Zealand
-
 Nigeria
-
 North Macedonia
-
 Norway
-
 Oman
Oman
-
 Pakistan
-
 Palestine
-
 Panama
-
 Papua New Guinea
-
 Paraguay
-
 Peru
Peru
-
 Philippines
-
 Poland
-
 Portugal
-
 Puerto Rico
-
 Qatar
Qatar
-
 Reunion
-
 Romania
-
 Rwanda
-
 Saudi Arabia
-
 Serbia
-
 Singapore
-
 Slovakia
-
 Slovenia
-
 Somalia
-
 South Africa
-
 Spain
Spain
-
 Sri Lanka
-
 Sweden
-
 Switzerland
-
 Syria
Syria
-
 Taiwan
-
 Tajikistan
-
 Tanzania
-
 Thailand
-
 Trinidad and Tobago
-
 Tunisia
-
 Turkey
-
 UAE
UAE
-
 Uganda
-
 Ukraine
-
 United Kingdom
-
United States
-
 Uruguay
-
 Uzbekistan
-
 Venezuela
-
 Vietnam
-
 Yemen
Yemen
-
 Zambia
-
 Zimbabwe
- Forex
- Crypto











