
-7.08% for Floki Inu as price remains stuck near $0.0000290–$0.0000345 range

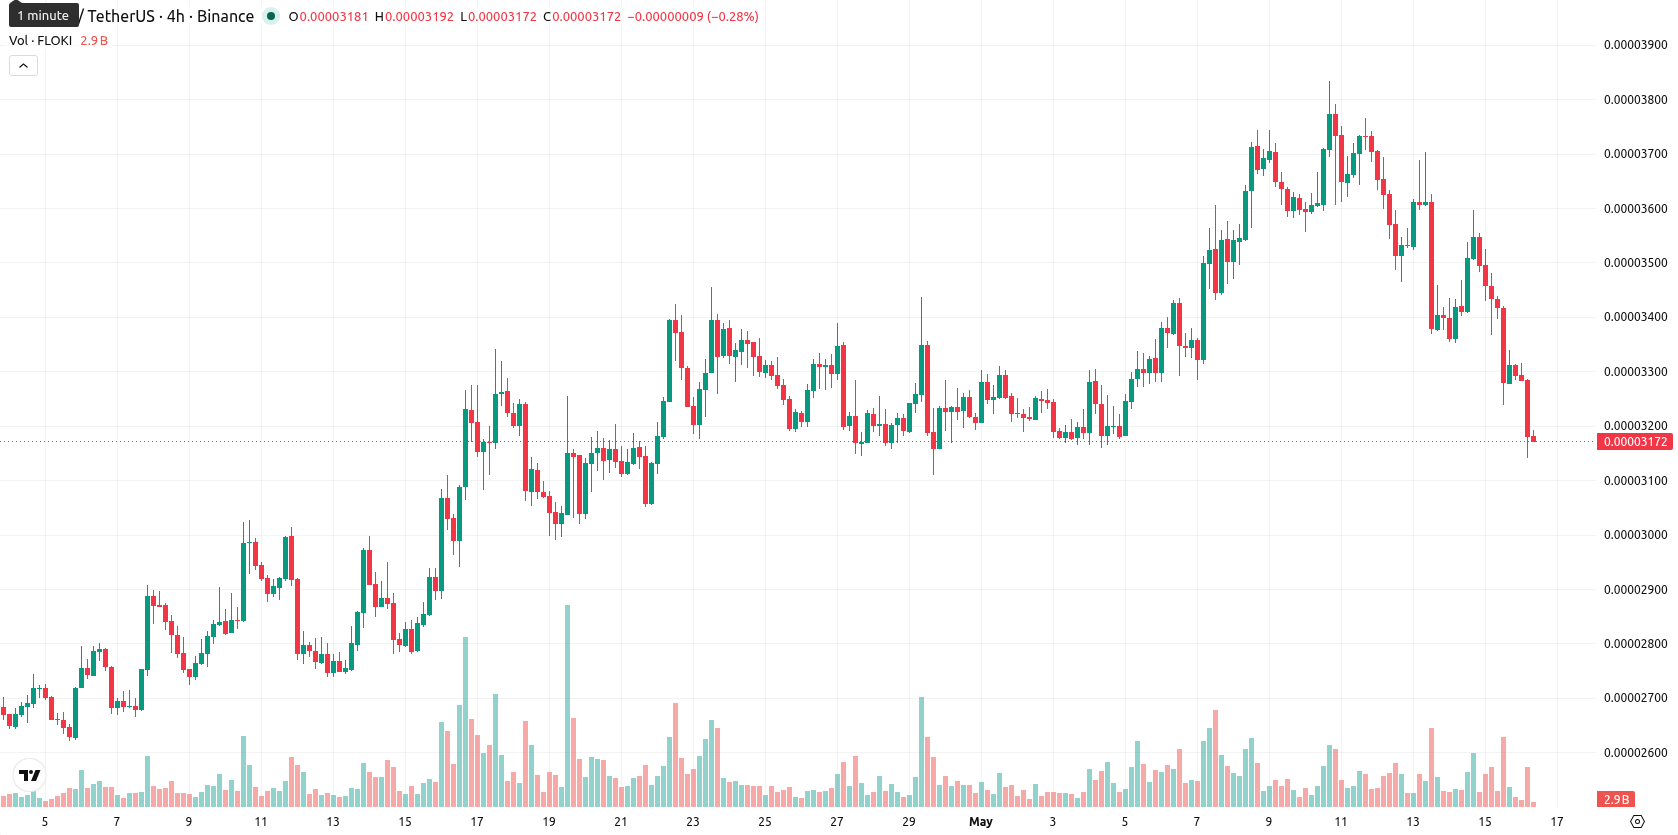
Floki Inu (FLOKI) is trading at $0.0000317 after a 7.08% decline on the day. The asset now sits below its key moving averages, with price showing notable intraday volatility.
Highlights
- FLOKI trades below short-term moving averages, signaling continued bearish sentiment and weak upside momentum.
- Mixed momentum indicators and high intraday volatility reflect persistent selling pressure and limited buyer support.
- Expected five-day price action is range-bound between $0.0000290 and $0.0000345, with less than 20% probability of a breakout higher.
Mixed indicator signals as resistance hardens and trend stays strong
On the technical front, FLOKI is trading below both the SMA-20 ($0.00003380) and the Ichimoku Kijun ($0.00003432), while holding just above the SMA-50 at $0.00003106. The Ichimoku Kijun marks immediate resistance, with the wide gap to the SMA-200 ($0.00003970) reinforcing long-term bearish pressure. D1 MACD signals a "Strong Buy," but other indicators are mixed: the RSI is neutral at 48, the CCI is neutral to slightly bearish, and the Stoch RSI is oversold. The Bull/Bear Power suggests some buyer presence, yet the price closed near the lower end of the daily range amid high volatility and steady selling after the open. The Awesome Oscillator remains flat, and the ADX confirms strong trend strength on the daily chart.
Downside risk elevates as breakout levels remain out of reach
FLOKI is expected to trade within a volatility band of $0.0000290 to $0.0000345 over the next five sessions. With D1 and W1 signals considered, the likelihood of a near-term upside move remains very low (less than 20%), positioning further downside as the more probable scenario. Baseline expectations point to sideways price action near current levels. A bullish breakout would require a sustained move above $0.0000343, while a break below $0.0000290 could trigger additional losses.
Earlier, analysts noted that Floki Inu was exhibiting mixed momentum signals and remained vulnerable to downside amid persistent technical resistance. Current technicals reinforce this caution, making a decisive break below $0.0000290 the critical level for traders to watch in the coming sessions.


Latest Floki News


-
 Afghanistan
-
 Albania
-
 Algeria
-
 Angola
-
 Argentina
-
 Armenia
-
 Australia
-
 Austria
-
 Azerbaijan
-
 Bahamas
-
 Bahrain
-
 Bangladesh
-
 Belarus
-
 Belgium
-
 Bolivia
-
 Botswana
-
 Brazil
-
 Brunei
-
 Bulgaria
-
 Cambodia
-
 Cameroon
-
 Canada
-
 Chile
Chile
-
 China
China
-
 Colombia
-
 Congo
Congo
-
 Costa Rica
-
 Cote d'Ivoire
-
 Croatia
-
 Cuba
Cuba
-
 Cyprus
-
 Czechia
-
 DR Congo
-
 Denmark
-
 Dominican Republic
-
 Ecuador
-
 Egypt
Egypt
-
 El Salvador
-
 Estonia
-
 Eswatini
-
 Ethiopia
-
 Finland
-
 France
-
 Georgia
-
 Germany
-
 Ghana
Ghana
-
 Greece
-
 Haiti
Haiti
-
 Hong Kong
-
 Hungary
-
 India
India
-
 Indonesia
-
 Iran, Islamic republic
-
 Iraq
Iraq
-
 Ireland
-
 Israel
-
 Italy
Italy
-
 Jamaica
-
 Japan
Japan
-
 Jordan
-
 Kazakhstan
-
 Kenya
Kenya
-
 Korea
Korea
-
 Kuwait
-
 Kyrgyzstan
-
 Laos
Laos
-
 Latvia
-
 Lebanon
-
 Lesotho
-
 Libya
Libya
-
 Lithuania
-
 Luxembourg
-
 Madagascar
-
 Malaysia
-
 Malta
Malta
-
 Mauritius
-
 Mexico
-
 Moldova
-
 Mongolia
-
 Montenegro
-
 Morocco
-
 Mozambique
-
 Myanmar
-
 Namibia
-
 Nepal
Nepal
-
 Netherlands
-
 New Zealand
-
 Nigeria
-
 North Macedonia
-
 Norway
-
 Oman
Oman
-
 Pakistan
-
 Palestine
-
 Panama
-
 Papua New Guinea
-
 Paraguay
-
 Peru
Peru
-
 Philippines
-
 Poland
-
 Portugal
-
 Puerto Rico
-
 Qatar
Qatar
-
 Reunion
-
 Romania
-
 Rwanda
-
 Saudi Arabia
-
 Serbia
-
 Singapore
-
 Slovakia
-
 Slovenia
-
 Somalia
-
 South Africa
-
 Spain
Spain
-
 Sri Lanka
-
 Sweden
-
 Switzerland
-
 Syria
Syria
-
 Taiwan
-
 Tajikistan
-
 Tanzania
-
 Thailand
-
 Trinidad and Tobago
-
 Tunisia
-
 Turkey
-
 UAE
UAE
-
 Uganda
-
 Ukraine
-
 United Kingdom
-
United States
-
 Uruguay
-
 Uzbekistan
-
 Venezuela
-
 Vietnam
-
 Yemen
Yemen
-
 Zambia
-
 Zimbabwe
- Forex
- Crypto
