
XRP price prediction: $1.3500 support in focus as XRP loses 1.91%

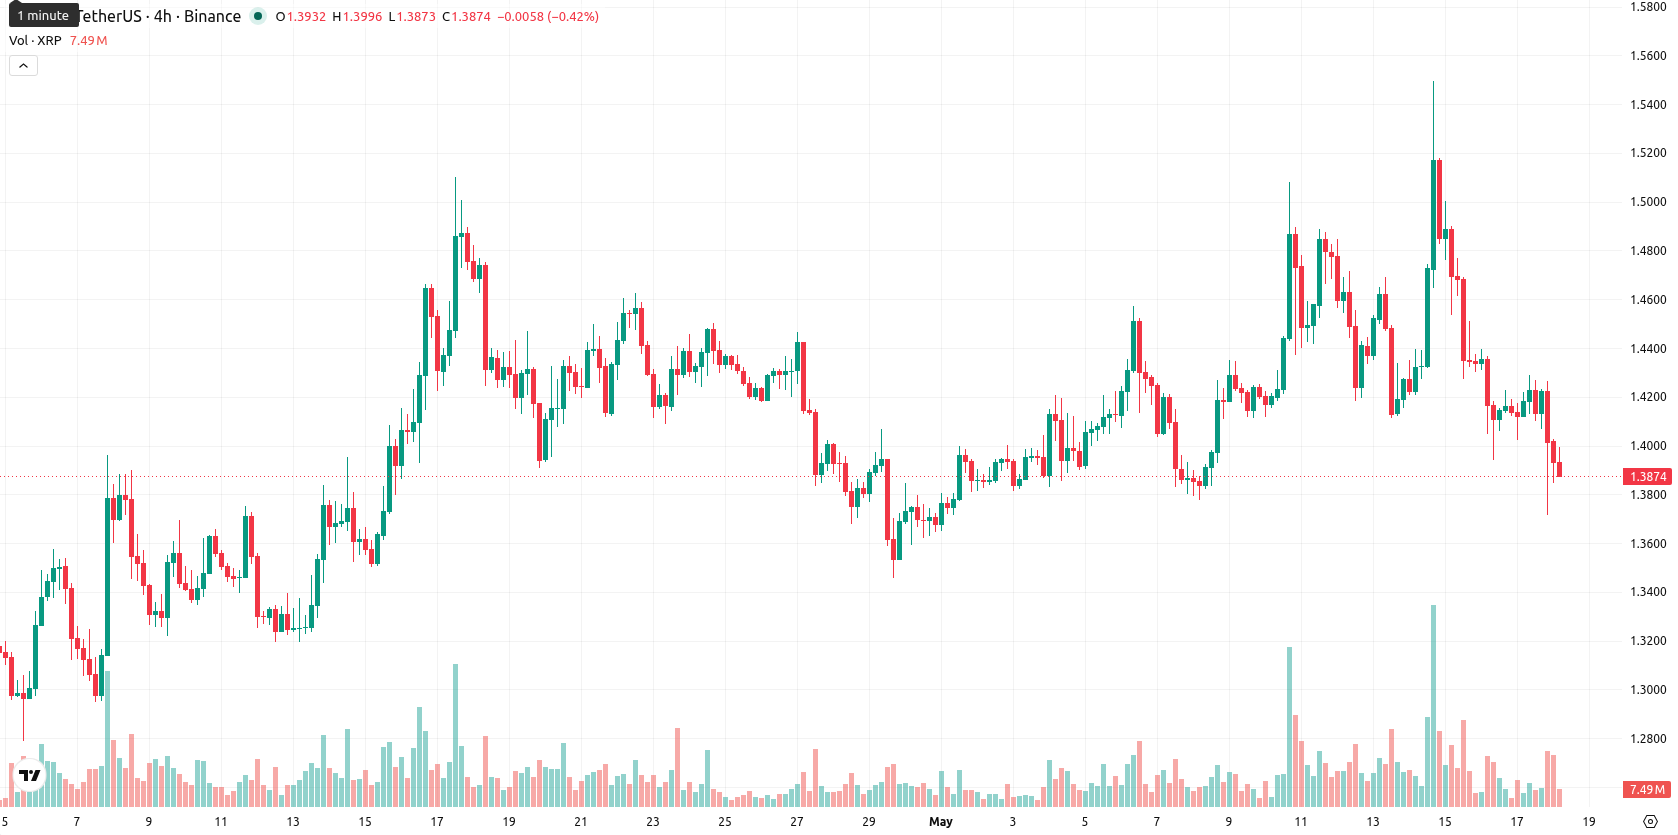
XRP (XRP) is trading at $1.3901, down 1.91% for the day. The price currently sits below its key short- and medium-term moving averages, indicating ongoing pressure in the near term.
Highlights
- XRP spot ETFs saw $60.495 million in net inflows from May 11–15, reflecting notable institutional participation despite recent price weakness.
- Ripple continues its XRP buyback initiative to support market liquidity, while a protocol upgrade is scheduled to go live in just over nine days.
- Technicals indicate XRP trades below key averages amid prevailing bearish momentum, with a forecasted sideways range of $1.3500 to $1.4500 in the near term.
Institutional inflows and network upgrade as price lags amid buybacks
Net inflows totaling $60.495 million were reported for XRP spot ETFs during the week of May 11 to May 15, reflecting substantial institutional allocation into asset-backed products. Ripple's ongoing buyback program, launched in the second quarter of 2024, has also repurchased XRP at defined price levels to bolster market liquidity. In addition, an upcoming network upgrade is scheduled via the fixCleanup3_1_3 amendment, with activation expected in just over nine days, indicating development activity on the protocol though price action has remained under broader selling pressure.
Technical resistance holds as oscillators show weak and mixed signals
Short-term moving averages for XRP show that the asset is trading below the SMA-20 ($1.4146) and SMA-50 ($1.3927), as well as under the long-term SMA-200 at $1.7201. Immediate resistance is defined by the Ichimoku Kijun level at $1.4477, while intraday support sits near $1.3500. On the daily chart, the MACD presents strong buy momentum, but the ADX is low at 14.2, indicating a weak directional trend. RSI is at 47.7 and CCI is near neutral, while the Stoch RSI is in oversold territory; this configuration points to potential short-term rebound attempts, although several oscillators—including HMA—still indicate downside risk. BBP shows only marginal buyer presence, and most intraday signals remain negative. The Awesome Oscillator is neutral, and price action is positioned near the lower end of today's trading range, highlighting ongoing volatility and mixed technical signals.
Sideways price action likely as breakout chances remain limited
Over the next five trading days, XRP is projected to oscillate within a volatility band from $1.3500 to $1.4500, centered close to present levels. The likelihood of a significant upward breakout is low, estimated at less than 20%. The base case remains a sideways pattern within this range. Should the price decisively break above $1.4477, a limited bullish scenario could emerge; conversely, a move below $1.3500 support may expose XRP to further downside over the short term.
Earlier, analysts noted that XRP was experiencing sustained selling pressure and a cautious technical outlook amid evolving institutional participation. Despite recent inflows into spot ETFs and ongoing protocol developments, traders should closely monitor for a decisive move above $1.4477 or below $1.3500, as these levels may signal a shift from the prevailing sideways scenario.


-
 Afghanistan
-
 Albania
-
 Algeria
-
 Angola
-
 Argentina
-
 Armenia
-
 Australia
-
 Austria
-
 Azerbaijan
-
 Bahamas
-
 Bahrain
-
 Bangladesh
-
 Belarus
-
 Belgium
-
 Bolivia
-
 Botswana
-
 Brazil
-
 Brunei
-
 Bulgaria
-
 Cambodia
-
 Cameroon
-
 Canada
-
 Chile
Chile
-
 China
China
-
 Colombia
-
 Congo
Congo
-
 Costa Rica
-
 Cote d'Ivoire
-
 Croatia
-
 Cuba
Cuba
-
 Cyprus
-
 Czechia
-
 DR Congo
-
 Denmark
-
 Dominican Republic
-
 Ecuador
-
 Egypt
Egypt
-
 El Salvador
-
 Estonia
-
 Eswatini
-
 Ethiopia
-
 Finland
-
 France
-
 Georgia
-
 Germany
-
 Ghana
Ghana
-
 Greece
-
 Haiti
Haiti
-
 Hong Kong
-
 Hungary
-
 India
India
-
 Indonesia
-
 Iran, Islamic republic
-
 Iraq
Iraq
-
 Ireland
-
 Israel
-
 Italy
Italy
-
 Jamaica
-
 Japan
Japan
-
 Jordan
-
 Kazakhstan
-
 Kenya
Kenya
-
 Korea
Korea
-
 Kuwait
-
 Kyrgyzstan
-
 Laos
Laos
-
 Latvia
-
 Lebanon
-
 Lesotho
-
 Libya
Libya
-
 Lithuania
-
 Luxembourg
-
 Madagascar
-
 Malaysia
-
 Malta
Malta
-
 Mauritius
-
 Mexico
-
 Moldova
-
 Mongolia
-
 Montenegro
-
 Morocco
-
 Mozambique
-
 Myanmar
-
 Namibia
-
 Nepal
Nepal
-
 Netherlands
-
 New Zealand
-
 Nigeria
-
 North Macedonia
-
 Norway
-
 Oman
Oman
-
 Pakistan
-
 Palestine
-
 Panama
-
 Papua New Guinea
-
 Paraguay
-
 Peru
Peru
-
 Philippines
-
 Poland
-
 Portugal
-
 Puerto Rico
-
 Qatar
Qatar
-
 Reunion
-
 Romania
-
 Rwanda
-
 Saudi Arabia
-
 Serbia
-
 Singapore
-
 Slovakia
-
 Slovenia
-
 Somalia
-
 South Africa
-
 Spain
Spain
-
 Sri Lanka
-
 Sweden
-
 Switzerland
-
 Syria
Syria
-
 Taiwan
-
 Tajikistan
-
 Tanzania
-
 Thailand
-
 Trinidad and Tobago
-
 Tunisia
-
 Turkey
-
 UAE
UAE
-
 Uganda
-
 Ukraine
-
 United Kingdom
-
United States
-
 Uruguay
-
 Uzbekistan
-
 Venezuela
-
 Vietnam
-
 Yemen
Yemen
-
 Zambia
-
 Zimbabwe
- Forex
- Crypto
