
OP price holds upper part of recent range facing MA-20 resistance: weekly report

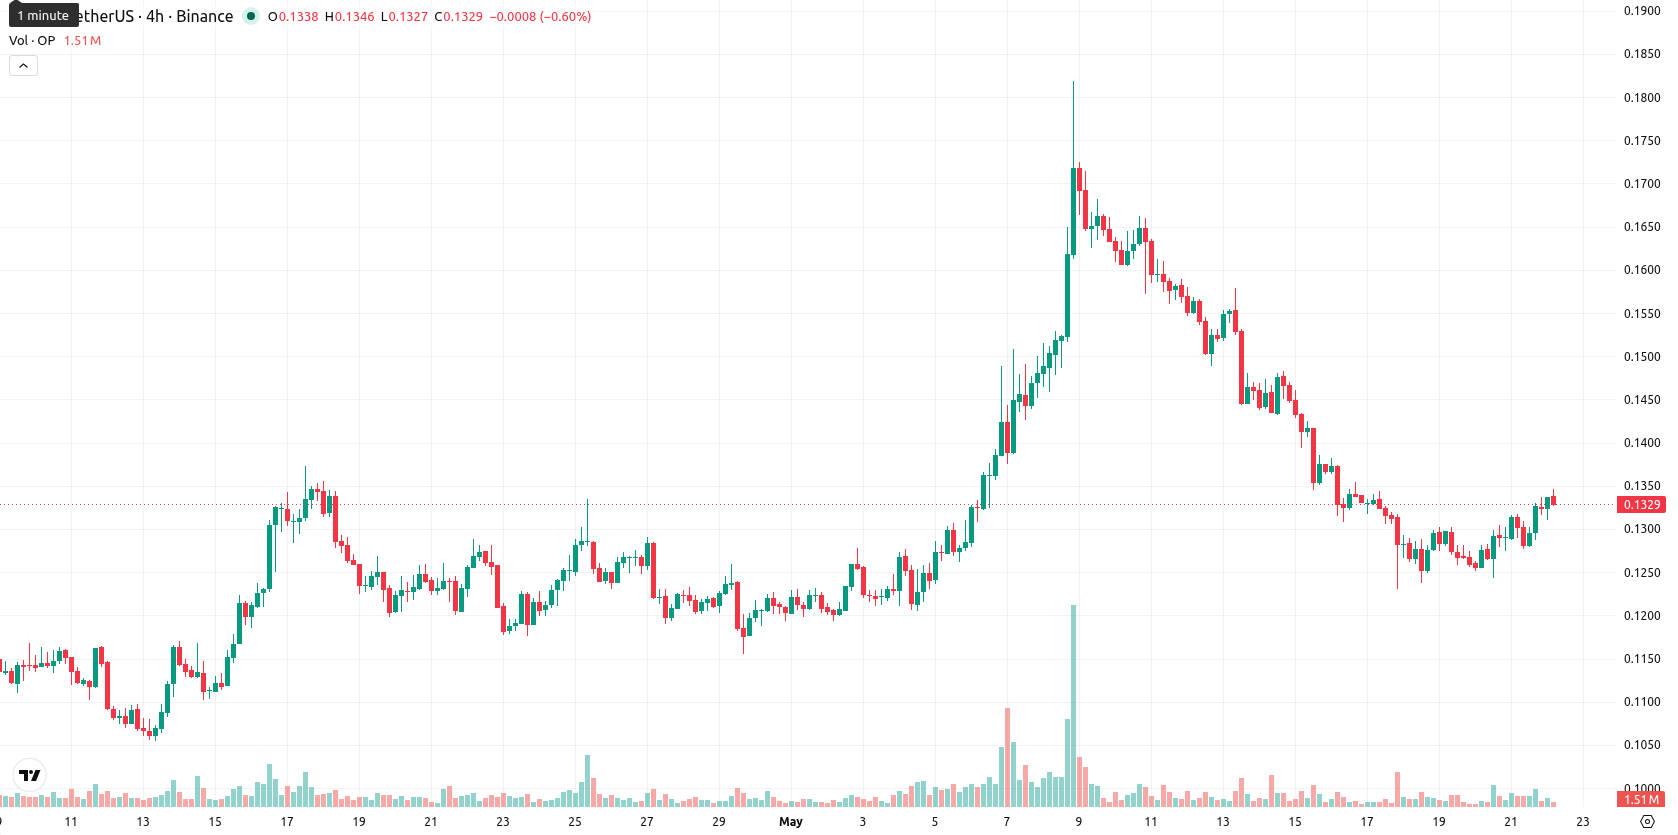
Optimism (OP) closed the week at $0.133, posting a decline of $0.0078 or 5.47% over the last seven days. The price remains below its weekly MA-20 ($0.1624) and MA-50 ($0.3946), indicating persistent medium- and longer-term downward pressure with OP holding the upper part of its recent weekly range.
Highlights
- OP continues to trend lower, trading below major moving averages, reflecting sustained medium- and long-term selling pressure.
- Momentum indicators remain decisively bearish, with strong downside signals and sellers dominating, though short-term oscillators show mixed readings.
- The expected seven-day range is $0.117 to $0.148, with consolidation likely and odds of further decline exceeding 80%.
Bearish momentum confirmed by weekly indicators and resistance clusters
On the weekly (W1) timeframe, all major moving averages point lower: OP stays well under both the MA-20 and MA-50, with the MA-20 at $0.1624 now serving as near-term resistance. The Ichimoku Kijun remains distant, reinforcing that dynamic resistance is clustered above. Weekly chart momentum signals are decisively bearish, with both the MACD and ADX confirming ongoing downside pressure. RSI prints 35, reflecting persistent weak momentum, though the Stochastic RSI at 77 suggests the risk of a short-term oversold bounce. The CCI is neutral, and Bull/Bear Power underscores continued control by sellers. Overall, technicals support a bearish to sideways structure with no buy signals.
Sideways-to-lower bias projected as bullish signals remain absent this week
For the next 7 days, OP is likely to consolidate between $0.117 and $0.148, as projected by historical volatility and the prevailing bearish weekly signals. There is less than a 20% probability of a meaningful move higher, given that none of the weekly indicators show bullish confirmation. A sustained drop below $0.117 could spark further declines, while a short-term momentum reversal could see a test toward the $0.148 resistance. Most probable is continued sideways-to-lower action within the defined range.
Earlier, analysts noted that Optimism faced ongoing bearish pressure, with technical indicators pointing to a limited chance of immediate recovery. The latest weekly developments reinforce this view, and traders should monitor for any decisive move beyond the $0.117–$0.148 range as a signal for the next directional shift.


Latest Optimism News


-
 Afghanistan
-
 Albania
-
 Algeria
-
 Angola
-
 Argentina
-
 Armenia
-
 Australia
-
 Austria
-
 Azerbaijan
-
 Bahamas
-
 Bahrain
-
 Bangladesh
-
 Belarus
-
 Belgium
-
 Bolivia
-
 Botswana
-
 Brazil
-
 Brunei
-
 Bulgaria
-
 Cambodia
-
 Cameroon
-
 Canada
-
 Chile
Chile
-
 China
China
-
 Colombia
-
 Congo
Congo
-
 Costa Rica
-
 Cote d'Ivoire
-
 Croatia
-
 Cuba
Cuba
-
 Cyprus
-
 Czechia
-
 DR Congo
-
 Denmark
-
 Dominican Republic
-
 Ecuador
-
 Egypt
Egypt
-
 El Salvador
-
 Estonia
-
 Eswatini
-
 Ethiopia
-
 Finland
-
 France
-
 Georgia
-
 Germany
-
 Ghana
Ghana
-
 Greece
-
 Haiti
Haiti
-
 Hong Kong
-
 Hungary
-
 India
India
-
 Indonesia
-
 Iran, Islamic republic
-
 Iraq
Iraq
-
 Ireland
-
 Israel
-
 Italy
Italy
-
 Jamaica
-
 Japan
Japan
-
 Jordan
-
 Kazakhstan
-
 Kenya
Kenya
-
 Korea
Korea
-
 Kuwait
-
 Kyrgyzstan
-
 Laos
Laos
-
 Latvia
-
 Lebanon
-
 Lesotho
-
 Libya
Libya
-
 Lithuania
-
 Luxembourg
-
 Madagascar
-
 Malaysia
-
 Malta
Malta
-
 Mauritius
-
 Mexico
-
 Moldova
-
 Mongolia
-
 Montenegro
-
 Morocco
-
 Mozambique
-
 Myanmar
-
 Namibia
-
 Nepal
Nepal
-
 Netherlands
-
 New Zealand
-
 Nigeria
-
 North Macedonia
-
 Norway
-
 Oman
Oman
-
 Pakistan
-
 Palestine
-
 Panama
-
 Papua New Guinea
-
 Paraguay
-
 Peru
Peru
-
 Philippines
-
 Poland
-
 Portugal
-
 Puerto Rico
-
 Qatar
Qatar
-
 Reunion
-
 Romania
-
 Rwanda
-
 Saudi Arabia
-
 Serbia
-
 Singapore
-
 Slovakia
-
 Slovenia
-
 Somalia
-
 South Africa
-
 Spain
Spain
-
 Sri Lanka
-
 Sweden
-
 Switzerland
-
 Syria
Syria
-
 Taiwan
-
 Tajikistan
-
 Tanzania
-
 Thailand
-
 Trinidad and Tobago
-
 Tunisia
-
 Turkey
-
 UAE
UAE
-
 Uganda
-
 Ukraine
-
 United Kingdom
-
United States
-
 Uruguay
-
 Uzbekistan
-
 Venezuela
-
 Vietnam
-
 Yemen
Yemen
-
 Zambia
-
 Zimbabwe
- Forex
- Crypto
