

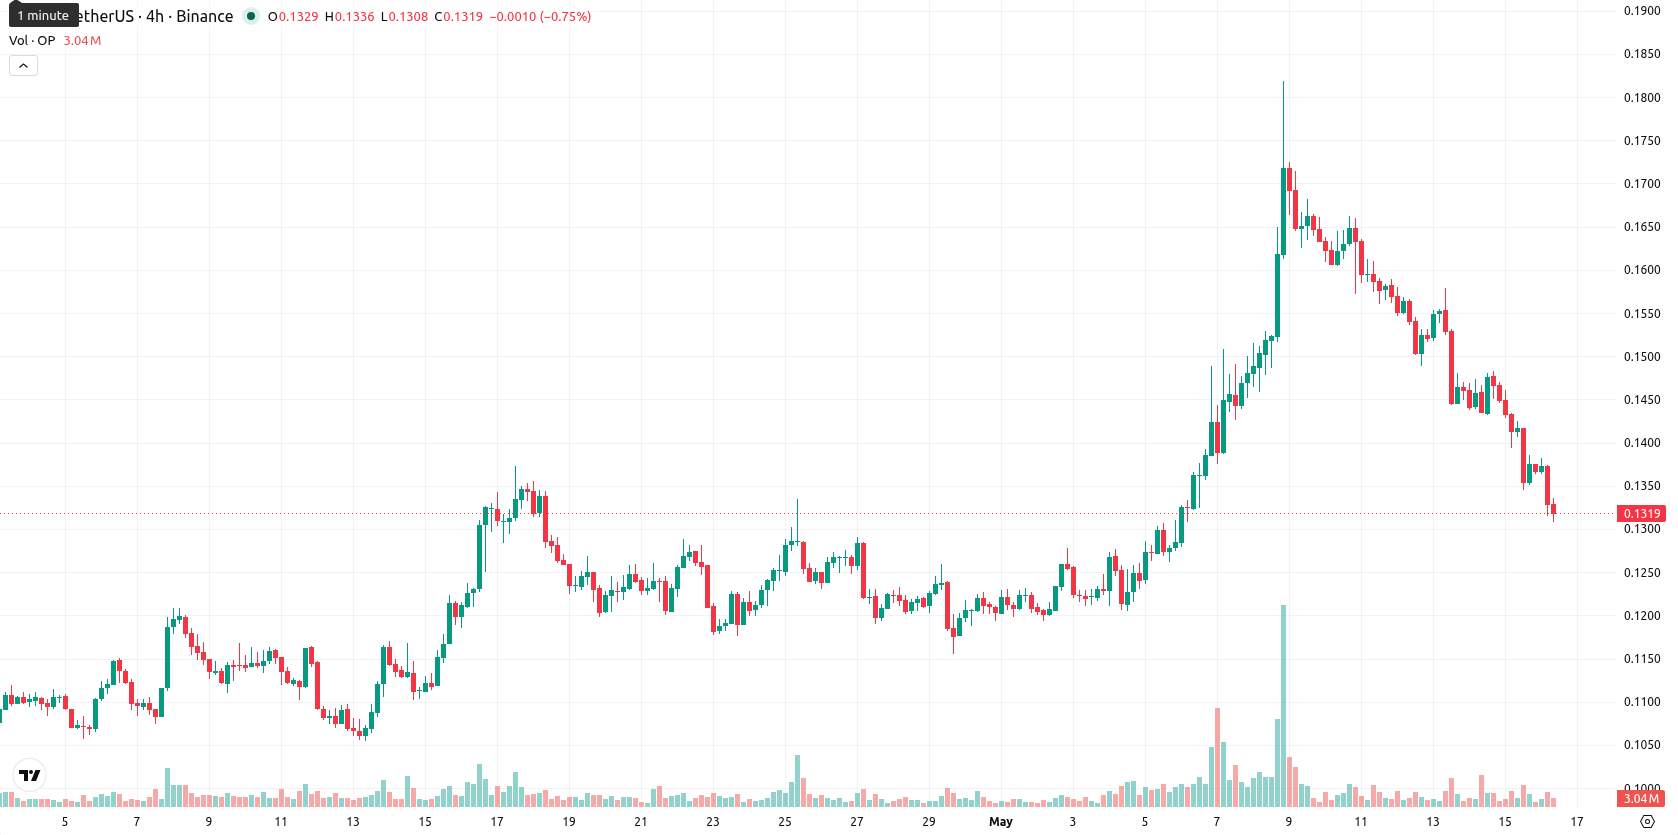
Optimism (OP) is trading at $0.1313, down 7.01% on the day and currently positioned below its key short-term moving averages, while remaining just above its medium-term benchmark.
Highlights
- OP trades under key moving averages, showing short-term downside pressure and persistent long-term resistance in a bearish configuration.
- Momentum indicators are mixed, with upside signals offset by weak trend conviction and oversold readings, indicating muted recovery potential.
- Expected weekly range is $0.125–$0.140, with major signals favoring further downside and sub-$0.125 breakdown risking new losses.
Divergent momentum signals as resistance holds above current price
On the technical front, OP is currently trading just above the SMA-50 at $0.1245, with the SMA-20 at $0.1378 and the Ichimoku Kijun at $0.1487 now acting as resistance levels. The MACD on the daily chart reflects a strong buy, whereas the ADX shows only modest trend conviction. The RSI prints a near-neutral 49.3 and the Stoch RSI is in oversold territory. Bull/Bear Power indicates a slight buyer edge. However, price action has hovered close to today's intraday low within a narrow range, and volatility remains moderate, with a clear divergence between momentum and oscillator signals.
Sideways bias under pressure as technicals warn of further weakness
Looking ahead to the coming week, the expected price corridor for OP is set within $0.125–$0.140, reflecting typical volatility relative to current levels. The probability of a price increase is assessed as very low (under 20%), as weekly technical signals point toward further weakness. The baseline scenario calls for OP to trade sideways under continued pressure. Should a rebound above $0.140 occur on renewed buying interest, upside could be unlocked; however, a breakdown below $0.125 would likely intensify selling and expose OP to further losses.
Earlier, analysts noted that Optimism was under persistent bearish pressure, with technical signals suggesting limited potential for an immediate rebound. The latest analysis reaffirms this subdued outlook, highlighting that a sustained move below the $0.125 level could heighten downside risks in the near term.


Latest Optimism News


-
 Afghanistan
-
 Albania
-
 Algeria
-
 Angola
-
 Argentina
-
 Armenia
-
 Australia
-
 Austria
-
 Azerbaijan
-
 Bahamas
-
 Bahrain
-
 Bangladesh
-
 Belarus
-
 Belgium
-
 Bolivia
-
 Botswana
-
 Brazil
-
 Brunei
-
 Bulgaria
-
 Cambodia
-
 Cameroon
-
 Canada
-
 Chile
Chile
-
 China
China
-
 Colombia
-
 Congo
Congo
-
 Costa Rica
-
 Cote d'Ivoire
-
 Croatia
-
 Cuba
Cuba
-
 Cyprus
-
 Czechia
-
 DR Congo
-
 Denmark
-
 Dominican Republic
-
 Ecuador
-
 Egypt
Egypt
-
 El Salvador
-
 Estonia
-
 Eswatini
-
 Ethiopia
-
 Finland
-
 France
-
 Georgia
-
 Germany
-
 Ghana
Ghana
-
 Greece
-
 Haiti
Haiti
-
 Hong Kong
-
 Hungary
-
 India
India
-
 Indonesia
-
 Iran, Islamic republic
-
 Iraq
Iraq
-
 Ireland
-
 Israel
-
 Italy
Italy
-
 Jamaica
-
 Japan
Japan
-
 Jordan
-
 Kazakhstan
-
 Kenya
Kenya
-
 Korea
Korea
-
 Kuwait
-
 Kyrgyzstan
-
 Laos
Laos
-
 Latvia
-
 Lebanon
-
 Lesotho
-
 Libya
Libya
-
 Lithuania
-
 Luxembourg
-
 Madagascar
-
 Malaysia
-
 Malta
Malta
-
 Mauritius
-
 Mexico
-
 Moldova
-
 Mongolia
-
 Montenegro
-
 Morocco
-
 Mozambique
-
 Myanmar
-
 Namibia
-
 Nepal
Nepal
-
 Netherlands
-
 New Zealand
-
 Nigeria
-
 North Macedonia
-
 Norway
-
 Oman
Oman
-
 Pakistan
-
 Palestine
-
 Panama
-
 Papua New Guinea
-
 Paraguay
-
 Peru
Peru
-
 Philippines
-
 Poland
-
 Portugal
-
 Puerto Rico
-
 Qatar
Qatar
-
 Reunion
-
 Romania
-
 Rwanda
-
 Saudi Arabia
-
 Serbia
-
 Singapore
-
 Slovakia
-
 Slovenia
-
 Somalia
-
 South Africa
-
 Spain
Spain
-
 Sri Lanka
-
 Sweden
-
 Switzerland
-
 Syria
Syria
-
 Taiwan
-
 Tajikistan
-
 Tanzania
-
 Thailand
-
 Trinidad and Tobago
-
 Tunisia
-
 Turkey
-
 UAE
UAE
-
 Uganda
-
 Ukraine
-
 United Kingdom
-
United States
-
 Uruguay
-
 Uzbekistan
-
 Venezuela
-
 Vietnam
-
 Yemen
Yemen
-
 Zambia
-
 Zimbabwe
- Forex
- Crypto
