
Sei climbs as developers accelerate move toward exclusive EVM support

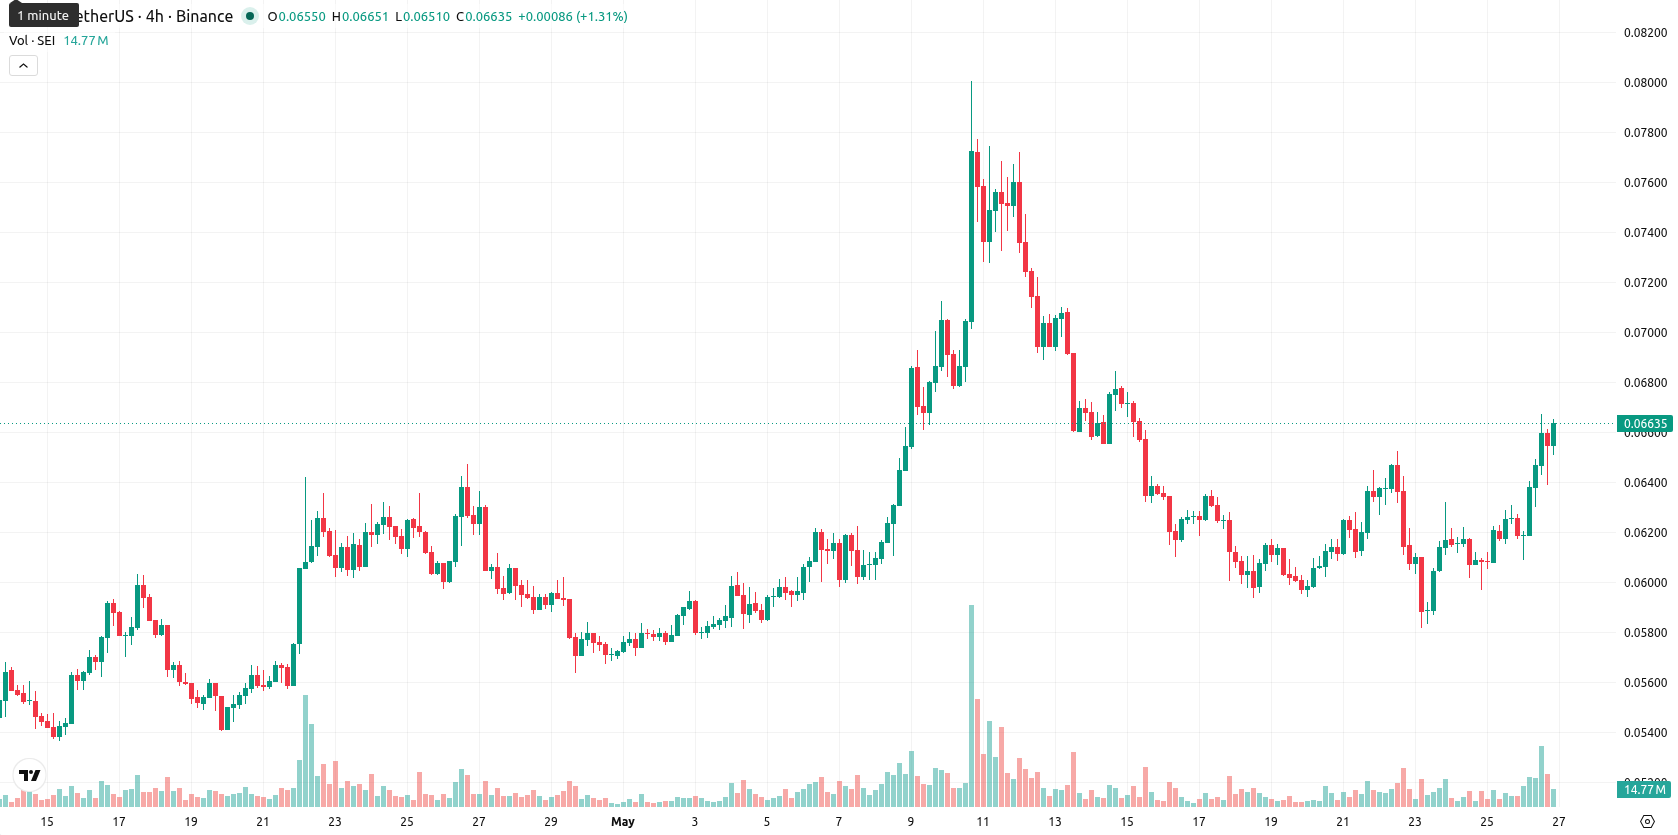
Sei (SEI) is trading at $0.0663 after rising 7.30% on the day. The asset is currently positioned above its key short- and mid-term moving averages, reflecting intraday bullish momentum.
Highlights
- Sei is considering an EVM-only architecture, signaling a major protocol shift that could end Cosmos smart contract support.
- This move aims to boost Sei's compatibility with Ethereum-based applications, potentially attracting new developer and user segments.
- SEI trades within a $0.0645–$0.0678 range, showing intraday bullish momentum but facing mixed technical indicators and long-term bearish bias.
Ethereum shift prospects drive attention amid protocol transition risk
Sei has signaled a potential shift to an EVM-only architecture, indicating that the network may reduce or end support for Cosmos smart contracts. Such a transition would represent a fundamental change in Sei’s protocol direction, increasing the platform's compatibility with Ethereum-based applications and potentially attracting a new segment of developers and users. This development has heightened market attention as token holders assess the implications for Sei’s strategic positioning and network adoption.
Mixed technical signals as momentum indicators diverge near resistance
The technical setup reveals SEI trading above the SMA-20 ($0.0646) and SMA-50 ($0.0604) but well below the SMA-200 at $0.0916. The Ichimoku Kijun sits at $0.0684, currently acting as immediate resistance. Indicators on the daily chart suggest mixed momentum: the ADX at 19.5 signals weak trend strength, the MACD is neutral, and the RSI at 49.0 reflects a slight selling tendency. Meanwhile, the Stoch RSI points to a strong buy, the CCI is neutral, and BBP highlights ongoing buyer dominance in intraday action. The Awesome Oscillator offers no clear directional bias, underscoring the divergence among momentum and oscillator readings.
Range-bound outlook persists as upside faces weak momentum
For the next five trading days, SEI is expected to fluctuate within a volatility band of $0.0645 to $0.0678. Weekly indicator readings suggest there is a low probability of sustained upward momentum, with downside risks remaining more likely. The baseline view is for range-bound trading in this corridor. A move above $0.0684 would open the way to test higher resistance, while a breach below $0.0645 could lead the price toward earlier support levels.
Previously it was reported that Sei faced persistent downside pressure amid muted technical momentum and a lack of clear bullish signals. The current technical and fundamental developments suggest the outlook has shifted, making a decisive move above the $0.0684 resistance level the key trigger for any further upside in the near term.


-
 Afghanistan
-
 Albania
-
 Algeria
-
 Angola
-
 Argentina
-
 Armenia
-
 Australia
-
 Austria
-
 Azerbaijan
-
 Bahamas
-
 Bahrain
-
 Bangladesh
-
 Belarus
-
 Belgium
-
 Bolivia
-
 Botswana
-
 Brazil
-
 Brunei
-
 Bulgaria
-
 Cambodia
-
 Cameroon
-
 Canada
-
 Chile
Chile
-
 China
China
-
 Colombia
-
 Congo
Congo
-
 Costa Rica
-
 Cote d'Ivoire
-
 Croatia
-
 Cuba
Cuba
-
 Cyprus
-
 Czechia
-
 DR Congo
-
 Denmark
-
 Dominican Republic
-
 Ecuador
-
 Egypt
Egypt
-
 El Salvador
-
 Estonia
-
 Eswatini
-
 Ethiopia
-
 Finland
-
 France
-
 Georgia
-
 Germany
-
 Ghana
Ghana
-
 Greece
-
 Haiti
Haiti
-
 Hong Kong
-
 Hungary
-
 India
India
-
 Indonesia
-
 Iran, Islamic republic
-
 Iraq
Iraq
-
 Ireland
-
 Israel
-
 Italy
Italy
-
 Jamaica
-
 Japan
Japan
-
 Jordan
-
 Kazakhstan
-
 Kenya
Kenya
-
 Korea
Korea
-
 Kuwait
-
 Kyrgyzstan
-
 Laos
Laos
-
 Latvia
-
 Lebanon
-
 Lesotho
-
 Libya
Libya
-
 Lithuania
-
 Luxembourg
-
 Madagascar
-
 Malaysia
-
 Malta
Malta
-
 Mauritius
-
 Mexico
-
 Moldova
-
 Mongolia
-
 Montenegro
-
 Morocco
-
 Mozambique
-
 Myanmar
-
 Namibia
-
 Nepal
Nepal
-
 Netherlands
-
 New Zealand
-
 Nigeria
-
 North Macedonia
-
 Norway
-
 Oman
Oman
-
 Pakistan
-
 Palestine
-
 Panama
-
 Papua New Guinea
-
 Paraguay
-
 Peru
Peru
-
 Philippines
-
 Poland
-
 Portugal
-
 Puerto Rico
-
 Qatar
Qatar
-
 Reunion
-
 Romania
-
 Rwanda
-
 Saudi Arabia
-
 Serbia
-
 Singapore
-
 Slovakia
-
 Slovenia
-
 Somalia
-
 South Africa
-
 Spain
Spain
-
 Sri Lanka
-
 Sweden
-
 Switzerland
-
 Syria
Syria
-
 Taiwan
-
 Tajikistan
-
 Tanzania
-
 Thailand
-
 Trinidad and Tobago
-
 Tunisia
-
 Turkey
-
 UAE
UAE
-
 Uganda
-
 Ukraine
-
 United Kingdom
-
United States
-
 Uruguay
-
 Uzbekistan
-
 Venezuela
-
 Vietnam
-
 Yemen
Yemen
-
 Zambia
-
 Zimbabwe
- Forex
- Crypto
