
Sei price prediction: Will $0.073 resistance cap further gains as SEI surges 11.63%?

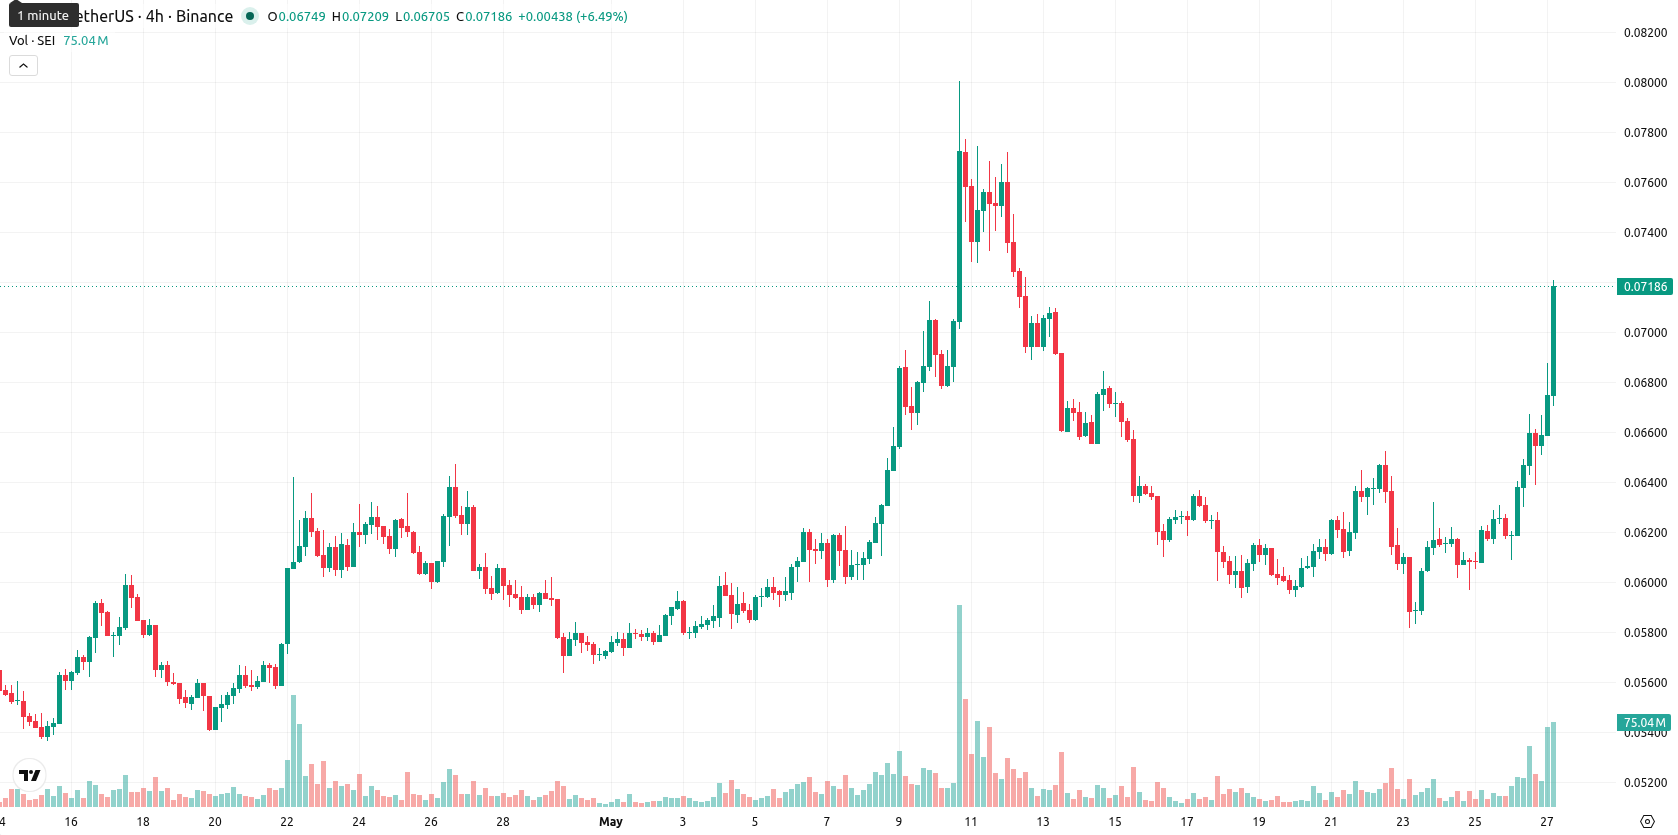
Sei (SEI) is trading at $0.0714, marking an 11.63% increase for the day. The asset currently sits above its key short- and medium-term moving averages, reflecting stronger short-term momentum.
Highlights
- SEI shows short- and medium-term bullish momentum but remains under long-term bearish pressure, below major moving averages.
- Momentum indicators signal buyer dominance and strong daily gains, yet overbought oscillators heighten the risk of a short-term pullback.
- For the coming week, SEI is expected to consolidate between $0.068 and $0.073, with downside risk dominating unless resistance at $0.073 is breached.
Momentum signals diverge as SEI holds above mid-term support
SEI is currently trading above the MA-20 ($0.0648) and MA-50 ($0.0607), but remains significantly below the MA-200 ($0.0910). The Ichimoku Kijun level on the daily chart stands at $0.0686, acting as immediate support beneath current prices. Momentum indicators are strong, with the MACD flagging a "Strong Buy" and the ADX reading near 20, suggesting trend formation is underway but not yet robust. RSI at 57 is bullish, and BBP points to buyer dominance; however, Stoch RSI is overbought at 100, highlighting near-term exhaustion risk. CCI remains neutral, while the Awesome Oscillator is not actively supporting the current trend.
Pullback risk rises as sideways consolidation dominates outlook
For the coming week, SEI is likely to remain within a $0.068 to $0.073 volatility band relative to current levels. The probability of further price increase is low (under 20%), making a pullback more likely. The baseline scenario points to sideways consolidation within this narrow band. A decisive move above $0.073 could trigger a bullish extension, while a drop below $0.068 would expose the asset to renewed downside risk tied to longer-term resistance.
Earlier, analysts noted that Sei was likely to consolidate as mixed signals and cautious momentum prevailed. The current analysis bolsters this view, highlighting tightening volatility and advising traders to closely monitor the $0.073 level as a potential inflection point for any shift in direction.


-
 Afghanistan
-
 Albania
-
 Algeria
-
 Angola
-
 Argentina
-
 Armenia
-
 Australia
-
 Austria
-
 Azerbaijan
-
 Bahamas
-
 Bahrain
-
 Bangladesh
-
 Belarus
-
 Belgium
-
 Bolivia
-
 Botswana
-
 Brazil
-
 Brunei
-
 Bulgaria
-
 Cambodia
-
 Cameroon
-
 Canada
-
 Chile
Chile
-
 China
China
-
 Colombia
-
 Congo
Congo
-
 Costa Rica
-
 Cote d'Ivoire
-
 Croatia
-
 Cuba
Cuba
-
 Cyprus
-
 Czechia
-
 DR Congo
-
 Denmark
-
 Dominican Republic
-
 Ecuador
-
 Egypt
Egypt
-
 El Salvador
-
 Estonia
-
 Eswatini
-
 Ethiopia
-
 Finland
-
 France
-
 Georgia
-
 Germany
-
 Ghana
Ghana
-
 Greece
-
 Haiti
Haiti
-
 Hong Kong
-
 Hungary
-
 India
India
-
 Indonesia
-
 Iran, Islamic republic
-
 Iraq
Iraq
-
 Ireland
-
 Israel
-
 Italy
Italy
-
 Jamaica
-
 Japan
Japan
-
 Jordan
-
 Kazakhstan
-
 Kenya
Kenya
-
 Korea
Korea
-
 Kuwait
-
 Kyrgyzstan
-
 Laos
Laos
-
 Latvia
-
 Lebanon
-
 Lesotho
-
 Libya
Libya
-
 Lithuania
-
 Luxembourg
-
 Madagascar
-
 Malaysia
-
 Malta
Malta
-
 Mauritius
-
 Mexico
-
 Moldova
-
 Mongolia
-
 Montenegro
-
 Morocco
-
 Mozambique
-
 Myanmar
-
 Namibia
-
 Nepal
Nepal
-
 Netherlands
-
 New Zealand
-
 Nigeria
-
 North Macedonia
-
 Norway
-
 Oman
Oman
-
 Pakistan
-
 Palestine
-
 Panama
-
 Papua New Guinea
-
 Paraguay
-
 Peru
Peru
-
 Philippines
-
 Poland
-
 Portugal
-
 Puerto Rico
-
 Qatar
Qatar
-
 Reunion
-
 Romania
-
 Rwanda
-
 Saudi Arabia
-
 Serbia
-
 Singapore
-
 Slovakia
-
 Slovenia
-
 Somalia
-
 South Africa
-
 Spain
Spain
-
 Sri Lanka
-
 Sweden
-
 Switzerland
-
 Syria
Syria
-
 Taiwan
-
 Tajikistan
-
 Tanzania
-
 Thailand
-
 Trinidad and Tobago
-
 Tunisia
-
 Turkey
-
 UAE
UAE
-
 Uganda
-
 Ukraine
-
 United Kingdom
-
United States
-
 Uruguay
-
 Uzbekistan
-
 Venezuela
-
 Vietnam
-
 Yemen
Yemen
-
 Zambia
-
 Zimbabwe
- Forex
- Crypto
