
VET drops amid oversold RSI conditions and strong selling pressure: weekly forecast

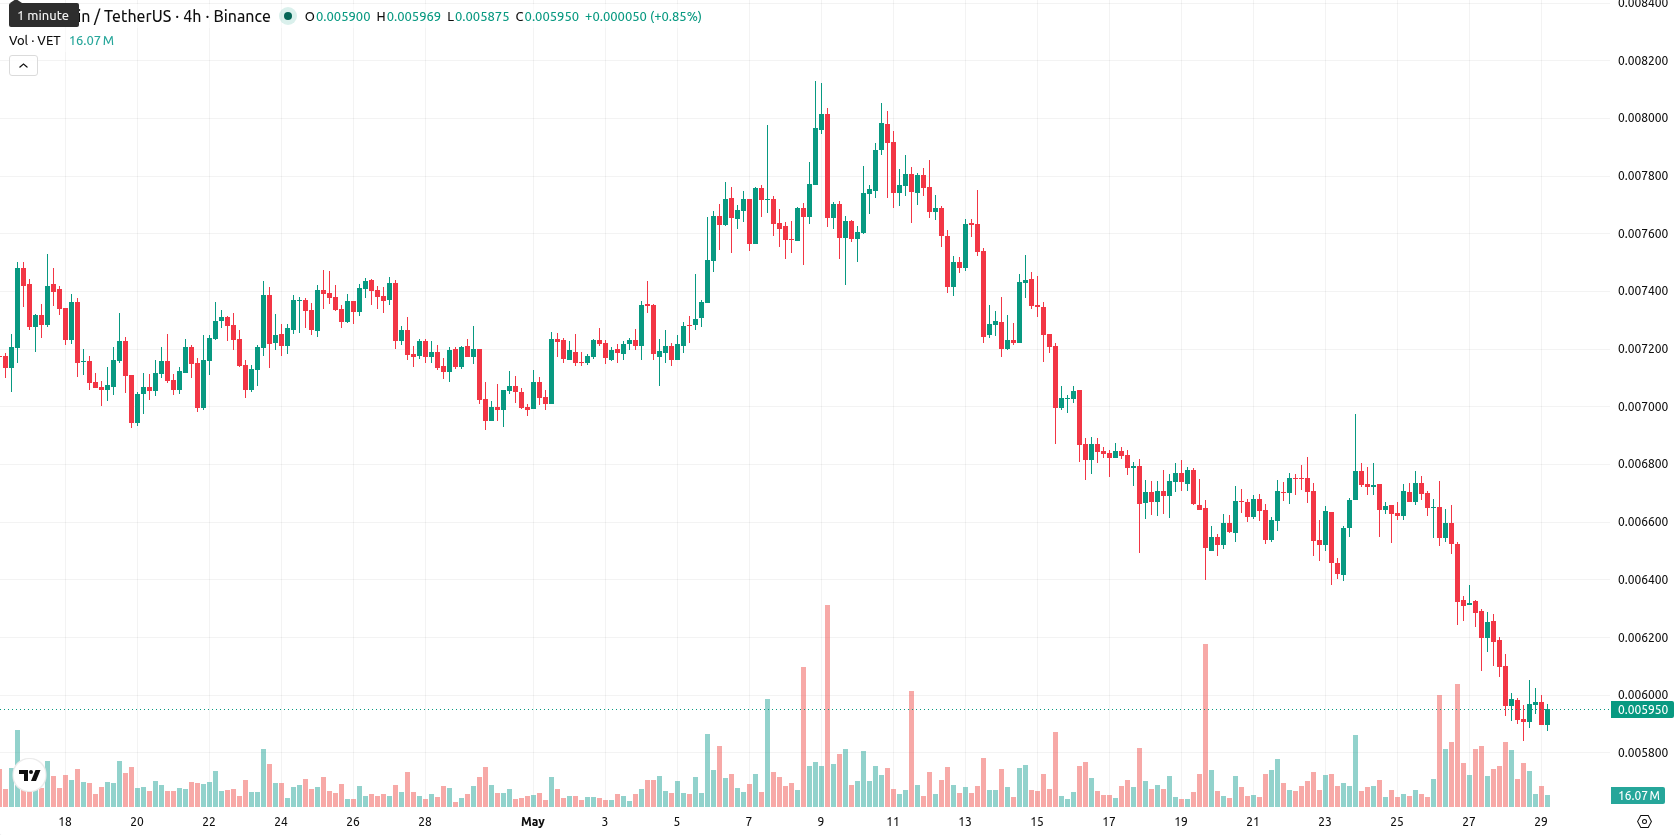
VeChain (VET) is currently trading at $0.005947, representing a decline of $0.000768 or 11.44% over the past week. The asset continues to trade below its weekly Moving Average-20 ($0.00752775), MA-50 ($0.01461090), and MA-200 ($0.02392808), indicating persistent downward momentum relative to key medium- and long-term moving averages.
Highlights
- VeChain (VET) trades well below key moving averages, confirming entrenched medium- and long-term bearish pressure.
- Momentum and trend indicators reflect ongoing weakness, with oversold signals dominating and no signs of reversal.
- VET is expected to remain constrained within a $0.00591–$0.00609 range this week, with sellers maintaining clear control.
Bearish momentum holds as major indicators signal oversold conditions
Weekly technical analysis highlights sustained bearish conditions for VET. The price remains below all major W1 moving averages, with the Ichimoku Kijun at $0.00980050 now serving as potential dynamic resistance and the MA-20 acting as the nearest significant barrier. Momentum indicators such as the MACD, ADX, and Awesome Oscillator point to strong selling pressure, while both the RSI and Commodity Channel Index show oversold signals. Stochastic RSI is holding at mid-range, and the Bull/Bear Power indicator confirms sellers dominate the current session.
Sideways to bearish outlook as resistance limits breakout risk next week
For the next 7 days, VET is anticipated to stay within a narrow range of $0.00591 to $0.00609. W1 indicators suggest a continuation of the current sideways to bearish movement with a low probability of a sustained upside. A break above immediate resistance at $0.00609 is unlikely without a reversal in weekly momentum, while a move below $0.00591 would confirm further weakness and reinforce bearish control.
Earlier, analysts noted that VeChain was entrenched in a persistent bearish trend with little evidence of a near-term reversal. This latest technical analysis further strengthens the bearish outlook, underscoring the importance of monitoring for a decisive move below $0.00591 as confirmation of continued downside risk.


-
 Afghanistan
-
 Albania
-
 Algeria
-
 Angola
-
 Argentina
-
 Armenia
-
 Australia
-
 Austria
-
 Azerbaijan
-
 Bahamas
-
 Bahrain
-
 Bangladesh
-
 Belarus
-
 Belgium
-
 Bolivia
-
 Botswana
-
 Brazil
-
 Brunei
-
 Bulgaria
-
 Cambodia
-
 Cameroon
-
 Canada
-
 Chile
Chile
-
 China
China
-
 Colombia
-
 Congo
Congo
-
 Costa Rica
-
 Cote d'Ivoire
-
 Croatia
-
 Cuba
Cuba
-
 Cyprus
-
 Czechia
-
 DR Congo
-
 Denmark
-
 Dominican Republic
-
 Ecuador
-
 Egypt
Egypt
-
 El Salvador
-
 Estonia
-
 Eswatini
-
 Ethiopia
-
 Finland
-
 France
-
 Georgia
-
 Germany
-
 Ghana
Ghana
-
 Greece
-
 Haiti
Haiti
-
 Hong Kong
-
 Hungary
-
 India
India
-
 Indonesia
-
 Iran, Islamic republic
-
 Iraq
Iraq
-
 Ireland
-
 Israel
-
 Italy
Italy
-
 Jamaica
-
 Japan
Japan
-
 Jordan
-
 Kazakhstan
-
 Kenya
Kenya
-
 Korea
Korea
-
 Kuwait
-
 Kyrgyzstan
-
 Laos
Laos
-
 Latvia
-
 Lebanon
-
 Lesotho
-
 Libya
Libya
-
 Lithuania
-
 Luxembourg
-
 Madagascar
-
 Malaysia
-
 Malta
Malta
-
 Mauritius
-
 Mexico
-
 Moldova
-
 Mongolia
-
 Montenegro
-
 Morocco
-
 Mozambique
-
 Myanmar
-
 Namibia
-
 Nepal
Nepal
-
 Netherlands
-
 New Zealand
-
 Nigeria
-
 North Macedonia
-
 Norway
-
 Oman
Oman
-
 Pakistan
-
 Palestine
-
 Panama
-
 Papua New Guinea
-
 Paraguay
-
 Peru
Peru
-
 Philippines
-
 Poland
-
 Portugal
-
 Puerto Rico
-
 Qatar
Qatar
-
 Reunion
-
 Romania
-
 Rwanda
-
 Saudi Arabia
-
 Serbia
-
 Singapore
-
 Slovakia
-
 Slovenia
-
 Somalia
-
 South Africa
-
 Spain
Spain
-
 Sri Lanka
-
 Sweden
-
 Switzerland
-
 Syria
Syria
-
 Taiwan
-
 Tajikistan
-
 Tanzania
-
 Thailand
-
 Trinidad and Tobago
-
 Tunisia
-
 Turkey
-
 UAE
UAE
-
 Uganda
-
 Ukraine
-
 United Kingdom
-
United States
-
 Uruguay
-
 Uzbekistan
-
 Venezuela
-
 Vietnam
-
 Yemen
Yemen
-
 Zambia
-
 Zimbabwe
- Forex
- Crypto
