
Limited downside prevents further losses as TRUMP drops sharply

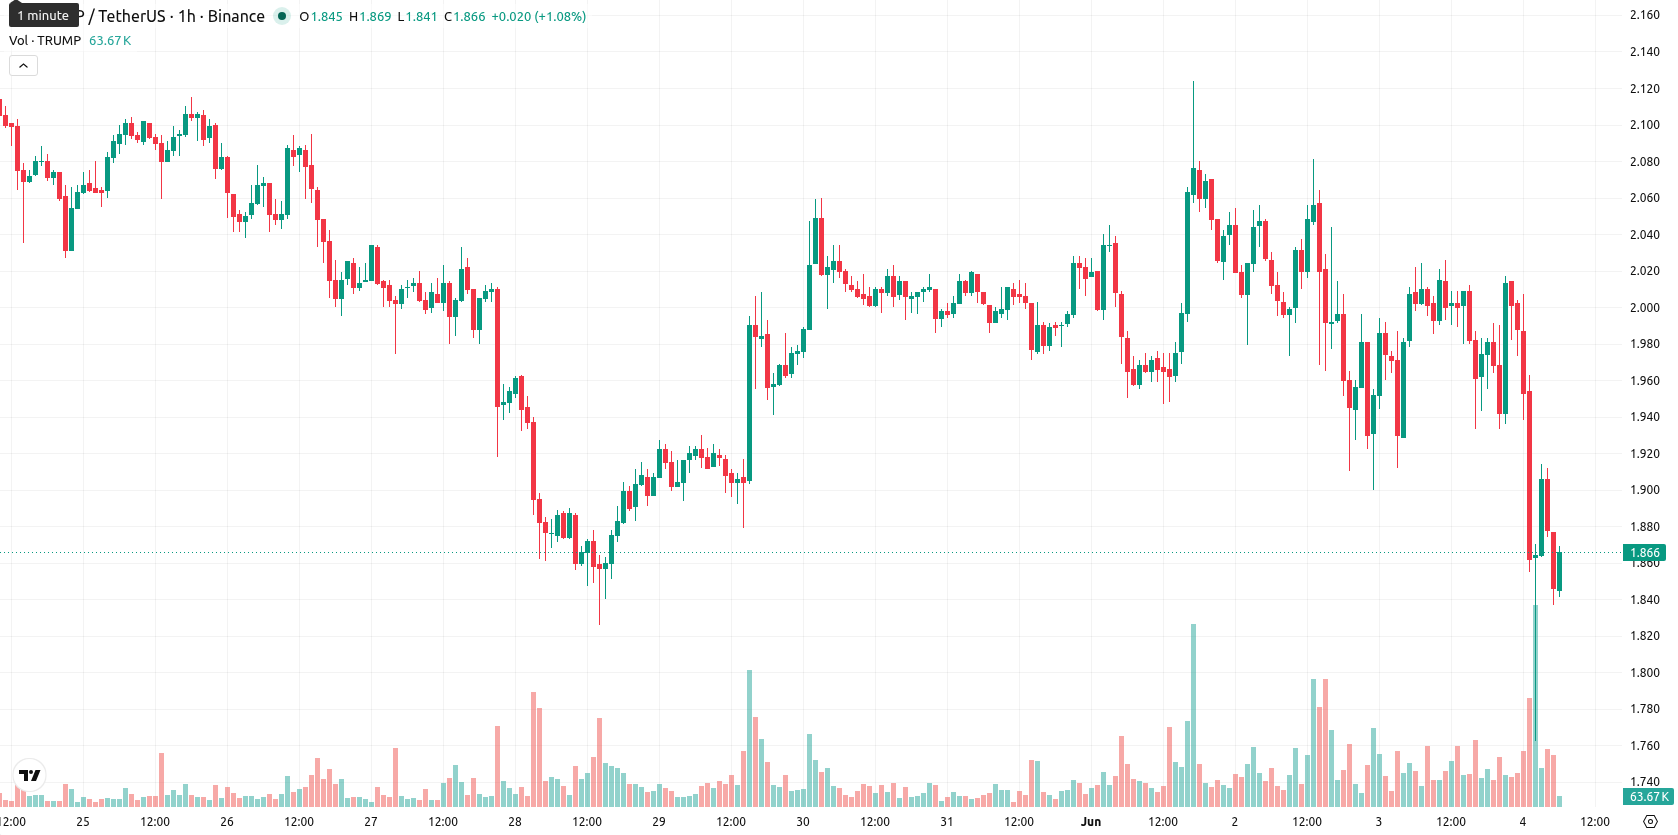
Official Trump (TRUMP) is trading at $1.84, registering a daily decline of 8.12%. The asset remains below its key moving averages, reflecting ongoing negative momentum.
 1.57
1.66
1.57
1.66
Highlights
- TRUMP continues a decisive bearish trend, trading well below all key moving averages across multiple timeframes.
- Momentum and oscillator indicators collectively reinforce strong seller control, with oversold conditions and no signs of imminent reversal.
- Price is expected to move between $1.75 and $1.99 over the next three days, with downside risk dominating unless $1.89 resistance breaks.
Sell bias persists amid oversold signals and high volatility
On the technical front, TRUMP is trading below the MA-20 ($1.97) and MA-50 ($1.98) on the H1 timeframe, with the price positioned well under the long-term MA-200 ($3.90). Immediate resistance is indicated by the Ichimoku Kijun at $1.89. Momentum indicators point toward sustained weakness: the MACD and ADX both maintain a sell bias, while the RSI registers at 38.58, signaling a sell condition. The Commodity Channel Index also confirms an oversold status. Stoch RSI is neutral, reflecting stretched intraday weakness absent a clear reversal trigger. BBP continues to indicate seller dominance, and the Awesome Oscillator aligns with this prevailing negative outlook. The price action shows little positive divergence across oscillators, with high volatility persisting.
Continued downside favored as breakout risk remains limited
The short-term outlook projects TRUMP within a $1.75 to $1.99 range over the next three sessions, in line with the current volatility band. A continuation of the decline remains the most probable scenario, with a bounce considered unlikely barring a breakout above the $1.89 resistance. A move below $1.75 would indicate further downside, whereas any consolidation is expected to occur within this corridor.
Earlier, it was reported that political and legal pressures led to the Trump administration halting its contentious $1.8 billion legal relief fund following a federal court ruling. The sustained negative technical momentum and lack of bullish triggers now reinforce downside risk for TRUMP, making a break below $1.75 a key level to monitor for further weakness.


Latest TRUMP News







-
 Afghanistan
-
 Albania
-
 Algeria
-
 Angola
-
 Argentina
-
 Armenia
-
 Australia
-
 Austria
-
 Azerbaijan
-
 Bahamas
-
 Bahrain
-
 Bangladesh
-
 Belarus
-
 Belgium
-
 Bolivia
-
 Botswana
-
 Brazil
-
 Brunei
-
 Bulgaria
-
 Cambodia
-
 Cameroon
-
 Canada
-
 Chile
Chile
-
 China
China
-
 Colombia
-
 Congo
Congo
-
 Costa Rica
-
 Cote d'Ivoire
-
 Croatia
-
 Cuba
Cuba
-
 Cyprus
-
 Czechia
-
 DR Congo
-
 Denmark
-
 Dominican Republic
-
 Ecuador
-
 Egypt
Egypt
-
 El Salvador
-
 Estonia
-
 Eswatini
-
 Ethiopia
-
 Finland
-
 France
-
 Georgia
-
 Germany
-
 Ghana
Ghana
-
 Greece
-
 Haiti
Haiti
-
 Hong Kong
-
 Hungary
-
 India
India
-
 Indonesia
-
 Iran, Islamic republic
-
 Iraq
Iraq
-
 Ireland
-
 Israel
-
 Italy
Italy
-
 Jamaica
-
 Japan
Japan
-
 Jordan
-
 Kazakhstan
-
 Kenya
Kenya
-
 Korea
Korea
-
 Kuwait
-
 Kyrgyzstan
-
 Laos
Laos
-
 Latvia
-
 Lebanon
-
 Lesotho
-
 Libya
Libya
-
 Lithuania
-
 Luxembourg
-
 Madagascar
-
 Malaysia
-
 Malta
Malta
-
 Mauritius
-
 Mexico
-
 Moldova
-
 Mongolia
-
 Montenegro
-
 Morocco
-
 Mozambique
-
 Myanmar
-
 Namibia
-
 Nepal
Nepal
-
 Netherlands
-
 New Zealand
-
 Nigeria
-
 North Macedonia
-
 Norway
-
 Oman
Oman
-
 Pakistan
-
 Palestine
-
 Panama
-
 Papua New Guinea
-
 Paraguay
-
 Peru
Peru
-
 Philippines
-
 Poland
-
 Portugal
-
 Puerto Rico
-
 Qatar
Qatar
-
 Reunion
-
 Romania
-
 Rwanda
-
 Saudi Arabia
-
 Serbia
-
 Singapore
-
 Slovakia
-
 Slovenia
-
 Somalia
-
 South Africa
-
 Spain
Spain
-
 Sri Lanka
-
 Sweden
-
 Switzerland
-
 Syria
Syria
-
 Taiwan
-
 Tajikistan
-
 Tanzania
-
 Thailand
-
 Trinidad and Tobago
-
 Tunisia
-
 Turkey
-
 UAE
UAE
-
 Uganda
-
 Ukraine
-
 United Kingdom
-
United States
-
 Uruguay
-
 Uzbekistan
-
 Venezuela
-
 Vietnam
-
 Yemen
Yemen
-
 Zambia
-
 Zimbabwe
- Forex
- Crypto











