
Flow price retreats as extended trading below long-term average weighs

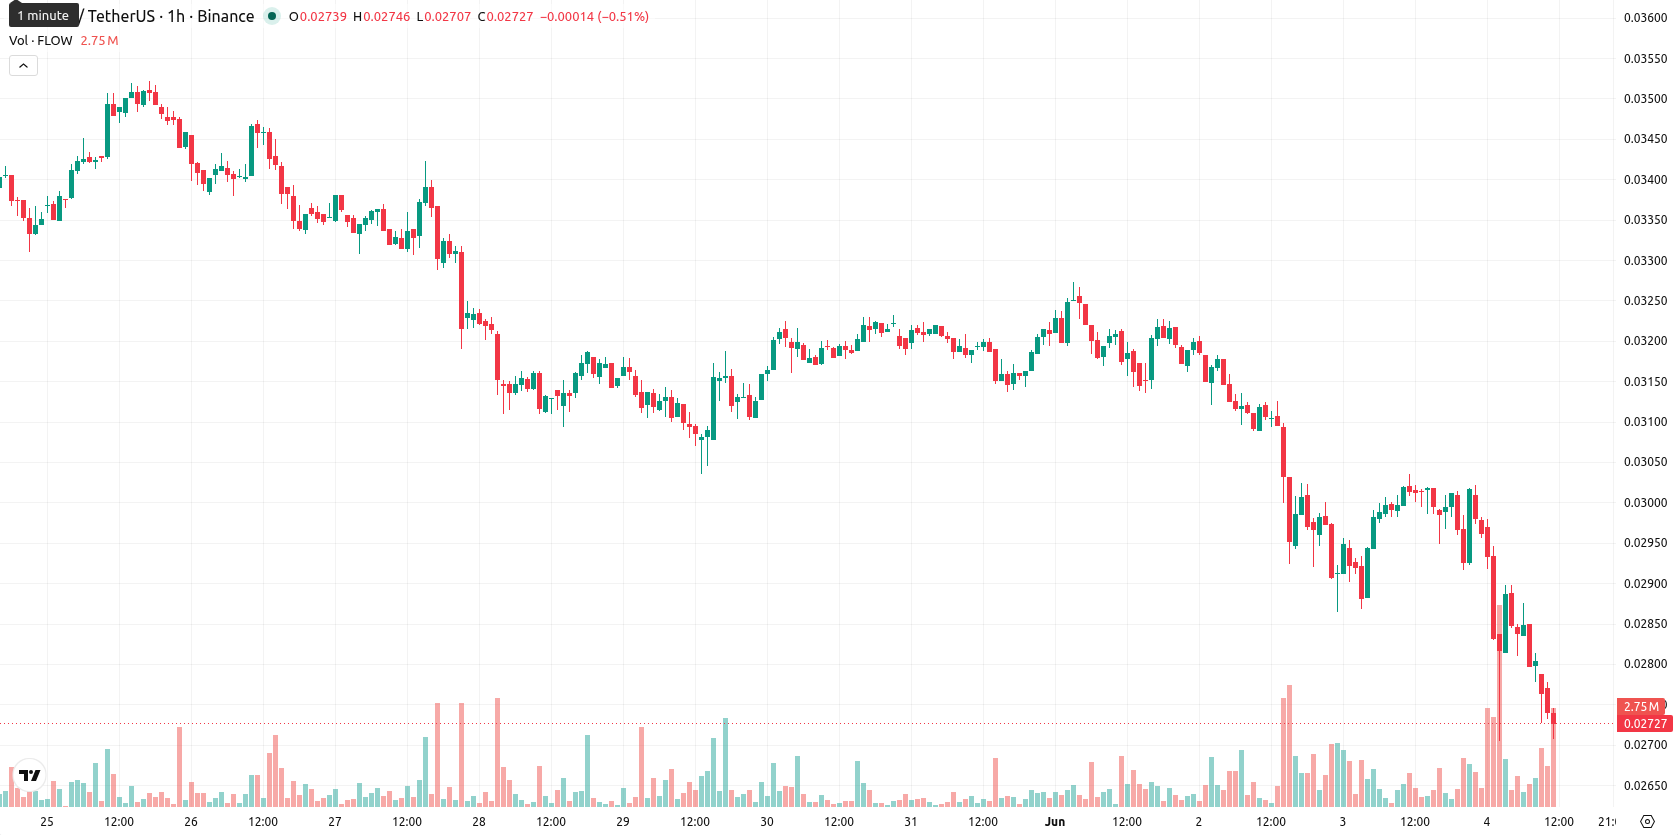
Flow (FLOW) is trading at $0.0275 after a daily decline of 8.8%. The asset sits below its key moving averages, reflecting broad weakness across short- and long-term timeframes.
Highlights
- FLOW/USD remains under persistent selling pressure, trading below key moving averages across all observed time frames.
- Momentum indicators unanimously signal weakness and confirm seller dominance, with several registering oversold conditions and no major bullish divergences.
- Price is expected to consolidate within the $0.0266–$0.0284 range over the next 2–3 days, with a higher probability of further downside if support at $0.0266 fails.
Oversold signals as momentum indicators reinforce downtrend
On the technical front, FLOW/USD is trading below its MA-20, MA-50, and the long-term MA-200 on the hourly chart. The Ichimoku Kijun level at $0.0289 serves as near-term resistance. Momentum readings remain weak: MACD and ADX are both on Sell, with RSI at 31.41 indicating oversold conditions. Stoch RSI and CCI also register oversold, and Bull/Bear Power signals continued seller dominance. The Awesome Oscillator supports the active downtrend. Price is near the low end of the daily range at $0.0275, having slipped with moderate volatility and no major divergences present among the indicators.
Downside risk rises as support level faces pressure
Over the next two to three trading days, FLOW/USD is expected to hold within a typical volatility band between $0.0266 and $0.0284. The likelihood of a rebound is considered low, with a higher probability of further downward movement if support at $0.0266 fails. Should price break above $0.0289, a renewed bullish scenario may develop, but for now, a sideways consolidation in the established range is seen as the baseline forecast.
Earlier, analysts noted that Flow was experiencing persistent bearish momentum marked by continued selling pressure and restrained recovery prospects. The current erosion below prior support further confirms this downtrend, making the $0.0266 level a critical pivot traders should monitor for potential breakdown or stabilization in the coming days.


Latest FLOW News


-
 Afghanistan
-
 Albania
-
 Algeria
-
 Angola
-
 Argentina
-
 Armenia
-
 Australia
-
 Austria
-
 Azerbaijan
-
 Bahamas
-
 Bahrain
-
 Bangladesh
-
 Belarus
-
 Belgium
-
 Bolivia
-
 Botswana
-
 Brazil
-
 Brunei
-
 Bulgaria
-
 Cambodia
-
 Cameroon
-
 Canada
-
 Chile
Chile
-
 China
China
-
 Colombia
-
 Congo
Congo
-
 Costa Rica
-
 Cote d'Ivoire
-
 Croatia
-
 Cuba
Cuba
-
 Cyprus
-
 Czechia
-
 DR Congo
-
 Denmark
-
 Dominican Republic
-
 Ecuador
-
 Egypt
Egypt
-
 El Salvador
-
 Estonia
-
 Eswatini
-
 Ethiopia
-
 Finland
-
 France
-
 Georgia
-
 Germany
-
 Ghana
Ghana
-
 Greece
-
 Haiti
Haiti
-
 Hong Kong
-
 Hungary
-
 India
India
-
 Indonesia
-
 Iran, Islamic republic
-
 Iraq
Iraq
-
 Ireland
-
 Israel
-
 Italy
Italy
-
 Jamaica
-
 Japan
Japan
-
 Jordan
-
 Kazakhstan
-
 Kenya
Kenya
-
 Korea
Korea
-
 Kuwait
-
 Kyrgyzstan
-
 Laos
Laos
-
 Latvia
-
 Lebanon
-
 Lesotho
-
 Libya
Libya
-
 Lithuania
-
 Luxembourg
-
 Madagascar
-
 Malaysia
-
 Malta
Malta
-
 Mauritius
-
 Mexico
-
 Moldova
-
 Mongolia
-
 Montenegro
-
 Morocco
-
 Mozambique
-
 Myanmar
-
 Namibia
-
 Nepal
Nepal
-
 Netherlands
-
 New Zealand
-
 Nigeria
-
 North Macedonia
-
 Norway
-
 Oman
Oman
-
 Pakistan
-
 Palestine
-
 Panama
-
 Papua New Guinea
-
 Paraguay
-
 Peru
Peru
-
 Philippines
-
 Poland
-
 Portugal
-
 Puerto Rico
-
 Qatar
Qatar
-
 Reunion
-
 Romania
-
 Rwanda
-
 Saudi Arabia
-
 Serbia
-
 Singapore
-
 Slovakia
-
 Slovenia
-
 Somalia
-
 South Africa
-
 Spain
Spain
-
 Sri Lanka
-
 Sweden
-
 Switzerland
-
 Syria
Syria
-
 Taiwan
-
 Tajikistan
-
 Tanzania
-
 Thailand
-
 Trinidad and Tobago
-
 Tunisia
-
 Turkey
-
 UAE
UAE
-
 Uganda
-
 Ukraine
-
 United Kingdom
-
United States
-
 Uruguay
-
 Uzbekistan
-
 Venezuela
-
 Vietnam
-
 Yemen
Yemen
-
 Zambia
-
 Zimbabwe
- Forex
- Crypto
