
Jupiter extends decline amid price trading far below its long-term average

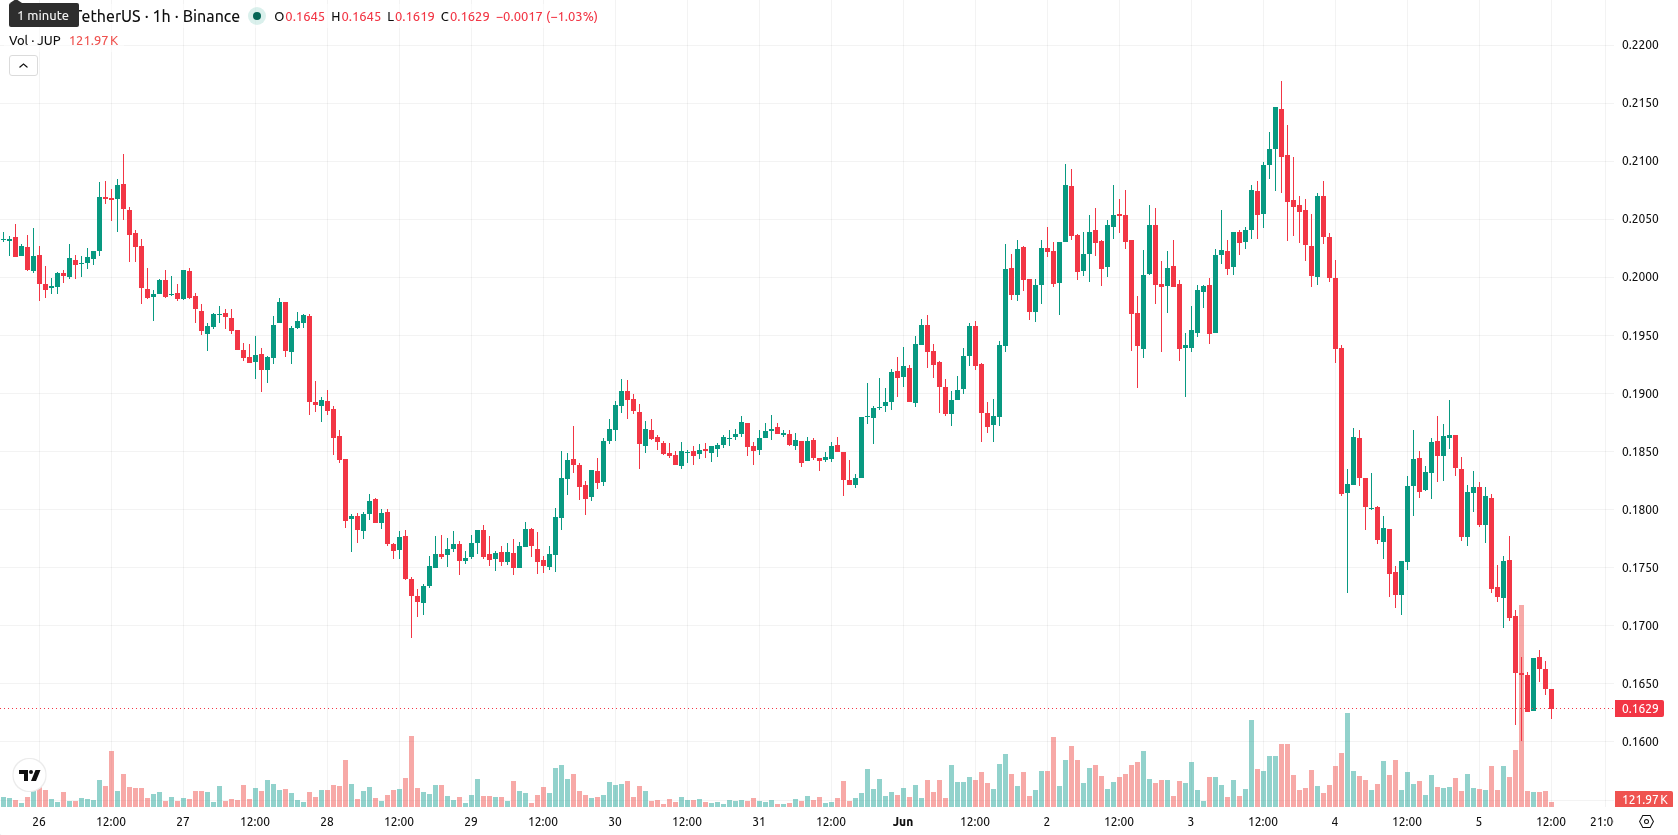
Jupiter (JUP) is trading at $0.1626, posting a daily decline of 7.77%. The token closed below its key moving averages, indicating it remains under short-term and medium-term technical pressure.
 0.1968
0.2193
0.1968
0.2193
Highlights
- Jupiter launched Forecast, a native prediction market connecting users to multiple market makers and widening its trading ecosystem beyond single-pool models.
- Forecast debuts with rapid 15-minute cryptocurrency price markets, aiming to complement—not compete with—platforms like Polymarket.
- JUP/USD faces sustained selling pressure, trading below major moving averages with momentum indicators signaling broad weakness and a near-term range of $0.1523 to $0.1738.
Ecosystem expansion as Forecast launches amid market pressure
Jupiter has launched Forecast, a native prediction market that allows users to engage with multiple competing market makers, moving beyond the typical single-liquidity pool model. The Forecast platform has been integrated with Jup Predict and is initially focused on 15-minute cryptocurrency price markets, expanding the utility and scope of Jupiter’s trading ecosystem. According to the company, Forecast is intended to complement rather than compete with existing platforms like Polymarket, though price action has remained under broader selling pressure.
Bearish momentum persists as major indicators flash sell signals
JUP/USD is trading below the MA-20 ($0.1756) and MA-50 ($0.1860) on the hourly chart, and remains under the daily MA-200 ($0.1908). The Ichimoku Kijun sits at $0.1747, currently marking the nearest resistance. Momentum indicators reflect continued weakness: RSI stands at 34.7, CCI is in oversold territory, and Sell signals are present on MACD, ADX, and Stoch RSI. BBP points to dominant seller activity, while the Awesome Oscillator is neutral, offering little offset to current downside pressure.
Sideways range anticipated as upside remains capped by resistance
In the short term, JUP is expected to trade within a volatility band between $0.1523 and $0.1738. The probability of an upward move appears low, with the downside risk remaining significant. The most likely scenario is sideways movement between these established support and resistance levels. An upward breakout above $0.1747 could open room for a short-term rally, while a sustained drop below $0.1523 may accelerate further losses.
Earlier, analysts noted that Jupiter was exhibiting sustained bearish momentum, constrained by persistent technical resistance and seller dominance. The latest developments confirm this ongoing weakness, with the recent launch of Forecast yet to offset downside risk, making $0.1523 the key level to monitor for potential further declines.








-
 Afghanistan
-
 Albania
-
 Algeria
-
 Angola
-
 Argentina
-
 Armenia
-
 Australia
-
 Austria
-
 Azerbaijan
-
 Bahamas
-
 Bahrain
-
 Bangladesh
-
 Belarus
-
 Belgium
-
 Bolivia
-
 Botswana
-
 Brazil
-
 Brunei
-
 Bulgaria
-
 Cambodia
-
 Cameroon
-
 Canada
-
 Chile
Chile
-
 China
China
-
 Colombia
-
 Congo
Congo
-
 Costa Rica
-
 Cote d'Ivoire
-
 Croatia
-
 Cuba
Cuba
-
 Cyprus
-
 Czechia
-
 DR Congo
-
 Denmark
-
 Dominican Republic
-
 Ecuador
-
 Egypt
Egypt
-
 El Salvador
-
 Estonia
-
 Eswatini
-
 Ethiopia
-
 Finland
-
 France
-
 Georgia
-
 Germany
-
 Ghana
Ghana
-
 Greece
-
 Haiti
Haiti
-
 Hong Kong
-
 Hungary
-
 India
India
-
 Indonesia
-
 Iran, Islamic republic
-
 Iraq
Iraq
-
 Ireland
-
 Israel
-
 Italy
Italy
-
 Jamaica
-
 Japan
Japan
-
 Jordan
-
 Kazakhstan
-
 Kenya
Kenya
-
 Korea
Korea
-
 Kuwait
-
 Kyrgyzstan
-
 Laos
Laos
-
 Latvia
-
 Lebanon
-
 Lesotho
-
 Libya
Libya
-
 Lithuania
-
 Luxembourg
-
 Madagascar
-
 Malaysia
-
 Malta
Malta
-
 Mauritius
-
 Mexico
-
 Moldova
-
 Mongolia
-
 Montenegro
-
 Morocco
-
 Mozambique
-
 Myanmar
-
 Namibia
-
 Nepal
Nepal
-
 Netherlands
-
 New Zealand
-
 Nigeria
-
 North Macedonia
-
 Norway
-
 Oman
Oman
-
 Pakistan
-
 Palestine
-
 Panama
-
 Papua New Guinea
-
 Paraguay
-
 Peru
Peru
-
 Philippines
-
 Poland
-
 Portugal
-
 Puerto Rico
-
 Qatar
Qatar
-
 Reunion
-
 Romania
-
 Rwanda
-
 Saudi Arabia
-
 Serbia
-
 Singapore
-
 Slovakia
-
 Slovenia
-
 Somalia
-
 South Africa
-
 Spain
Spain
-
 Sri Lanka
-
 Sweden
-
 Switzerland
-
 Syria
Syria
-
 Taiwan
-
 Tajikistan
-
 Tanzania
-
 Thailand
-
 Trinidad and Tobago
-
 Tunisia
-
 Turkey
-
 UAE
UAE
-
 Uganda
-
 Ukraine
-
 United Kingdom
-
United States
-
 Uruguay
-
 Uzbekistan
-
 Venezuela
-
 Vietnam
-
 Yemen
Yemen
-
 Zambia
-
 Zimbabwe
- Forex
- Crypto











