

Raydium drops as price struggles to push past immediate resistance

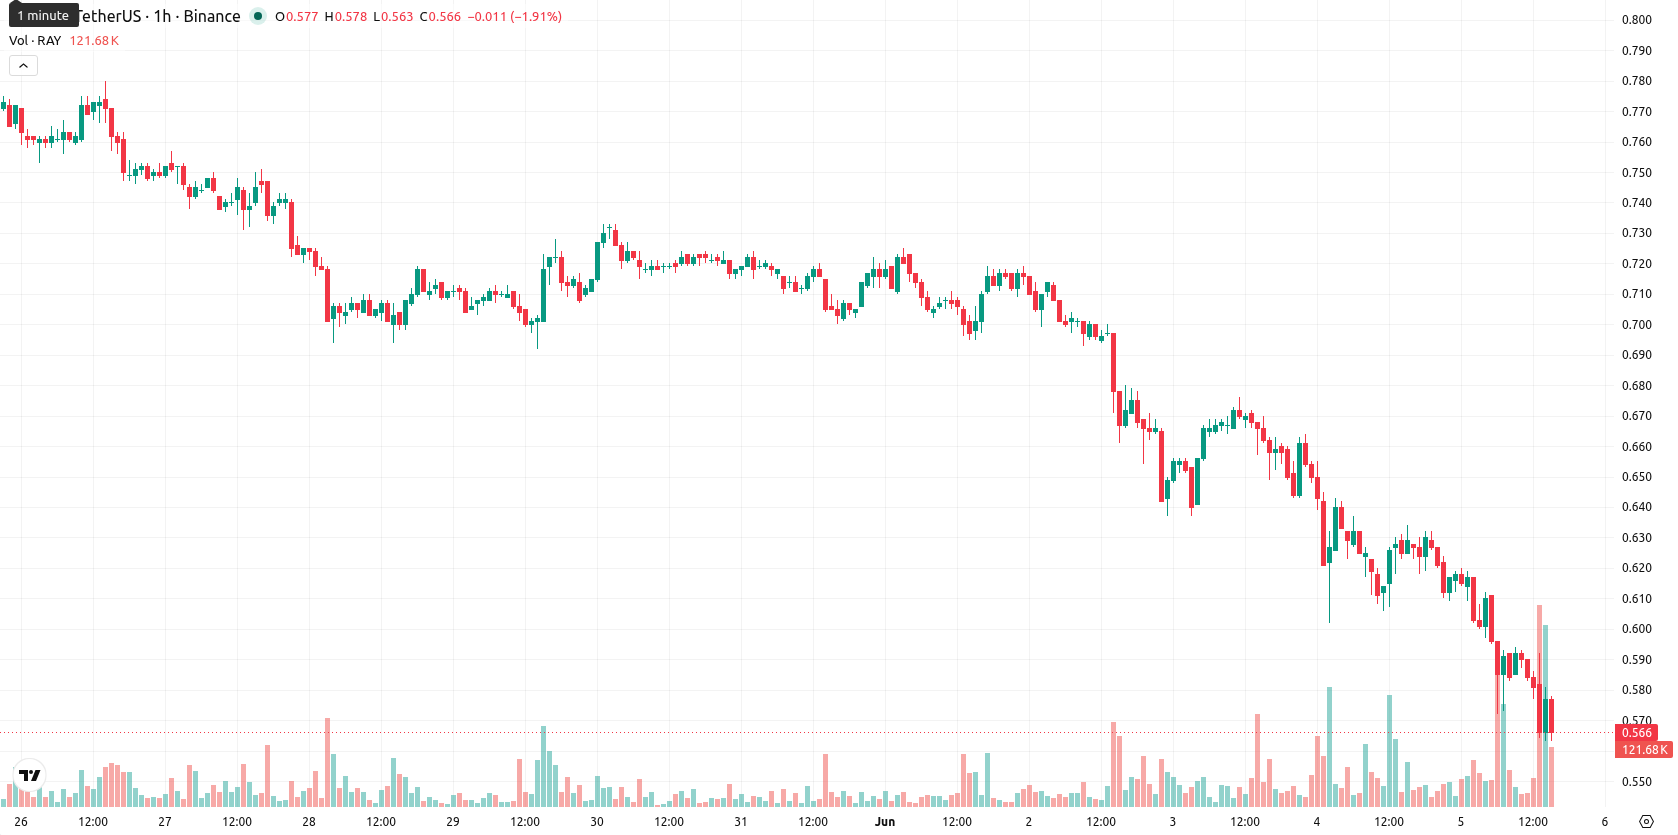
Raydium (RAY) is trading at $0.5680, marking a daily drop of 9.98%. The asset is positioned below its key moving averages, signaling ongoing pressure in the current session.
 2.1904
2.5729
2.1904
2.5729
Highlights
- RAY/USD remains under sustained selling pressure, trading below key short- and long-term moving averages amid a roughly 10% intraday decline.
- Momentum indicators overwhelmingly signal bearish trend continuation, though oversold conditions raise odds of a brief technical rebound.
- Expected price range for the next 1–2 days is $0.5387 to $0.5973, with a 79% probability of further downside unless resistance at $0.5985 is reclaimed.
Bearish signals persist as oscillators diverge in volatile trade
On the hourly chart, RAY/USD is trading below the MA-20 ($0.5994), MA-50 ($0.6225), and the long-term MA-200 ($0.8160), with the Ichimoku Kijun at $0.5985 now serving as the immediate resistance. Momentum signals remain negative: MACD and ADX both issue sell signals, RSI reads 36.562 (Sell), and CCI sits in oversold territory. While Bull/Bear Power (BBP) confirms seller dominance and the Awesome Oscillator aligns with widespread bearish momentum, Stoch RSI stands out with a strong buy signal, pointing to a divergence among oscillators. Price action reveals a small negative gap of $0.013, sustained near the daily low, and volatile trading conditions.
Sideways bias holds as downside remains probable amid volatility
Over the next one to two trading days, RAY is likely to oscillate within a volatility band of $0.5387 to $0.5973. There is a 79% probability of further downside, with a 21% chance for a rebound. The baseline scenario calls for sideways consolidation. A move above $0.5985 would open a bullish scenario, while a drop below $0.5387 would signal renewed downside risk.
Earlier, analysts noted that Raydium was experiencing sustained bearish momentum and limited breakout potential as sellers retained control. The latest analysis reinforces this view by highlighting ongoing negative signals, suggesting traders should closely monitor volatility and prepare for potential downside moves in the coming sessions.





Latest Raydium News





-
 Afghanistan
-
 Albania
-
 Algeria
-
 Angola
-
 Argentina
-
 Armenia
-
 Australia
-
 Austria
-
 Azerbaijan
-
 Bahamas
-
 Bahrain
-
 Bangladesh
-
 Belarus
-
 Belgium
-
 Bolivia
-
 Botswana
-
 Brazil
-
 Brunei
-
 Bulgaria
-
 Cambodia
-
 Cameroon
-
 Canada
-
 Chile
Chile
-
 China
China
-
 Colombia
-
 Congo
Congo
-
 Costa Rica
-
 Cote d'Ivoire
-
 Croatia
-
 Cuba
Cuba
-
 Cyprus
-
 Czechia
-
 DR Congo
-
 Denmark
-
 Dominican Republic
-
 Ecuador
-
 Egypt
Egypt
-
 El Salvador
-
 Estonia
-
 Eswatini
-
 Ethiopia
-
 Finland
-
 France
-
 Georgia
-
 Germany
-
 Ghana
Ghana
-
 Greece
-
 Haiti
Haiti
-
 Hong Kong
-
 Hungary
-
 India
India
-
 Indonesia
-
 Iran, Islamic republic
-
 Iraq
Iraq
-
 Ireland
-
 Israel
-
 Italy
Italy
-
 Jamaica
-
 Japan
Japan
-
 Jordan
-
 Kazakhstan
-
 Kenya
Kenya
-
 Korea
Korea
-
 Kuwait
-
 Kyrgyzstan
-
 Laos
Laos
-
 Latvia
-
 Lebanon
-
 Lesotho
-
 Libya
Libya
-
 Lithuania
-
 Luxembourg
-
 Madagascar
-
 Malaysia
-
 Malta
Malta
-
 Mauritius
-
 Mexico
-
 Moldova
-
 Mongolia
-
 Montenegro
-
 Morocco
-
 Mozambique
-
 Myanmar
-
 Namibia
-
 Nepal
Nepal
-
 Netherlands
-
 New Zealand
-
 Nigeria
-
 North Macedonia
-
 Norway
-
 Oman
Oman
-
 Pakistan
-
 Palestine
-
 Panama
-
 Papua New Guinea
-
 Paraguay
-
 Peru
Peru
-
 Philippines
-
 Poland
-
 Portugal
-
 Puerto Rico
-
 Qatar
Qatar
-
 Reunion
-
 Romania
-
 Rwanda
-
 Saudi Arabia
-
 Serbia
-
 Singapore
-
 Slovakia
-
 Slovenia
-
 Somalia
-
 South Africa
-
 Spain
Spain
-
 Sri Lanka
-
 Sweden
-
 Switzerland
-
 Syria
Syria
-
 Taiwan
-
 Tajikistan
-
 Tanzania
-
 Thailand
-
 Trinidad and Tobago
-
 Tunisia
-
 Turkey
-
 UAE
UAE
-
 Uganda
-
 Ukraine
-
 United Kingdom
-
United States
-
 Uruguay
-
 Uzbekistan
-
 Venezuela
-
 Vietnam
-
 Yemen
Yemen
-
 Zambia
-
 Zimbabwe
- Forex
- Crypto












