
Movement falls 7.14% as price tests $0.0109 support

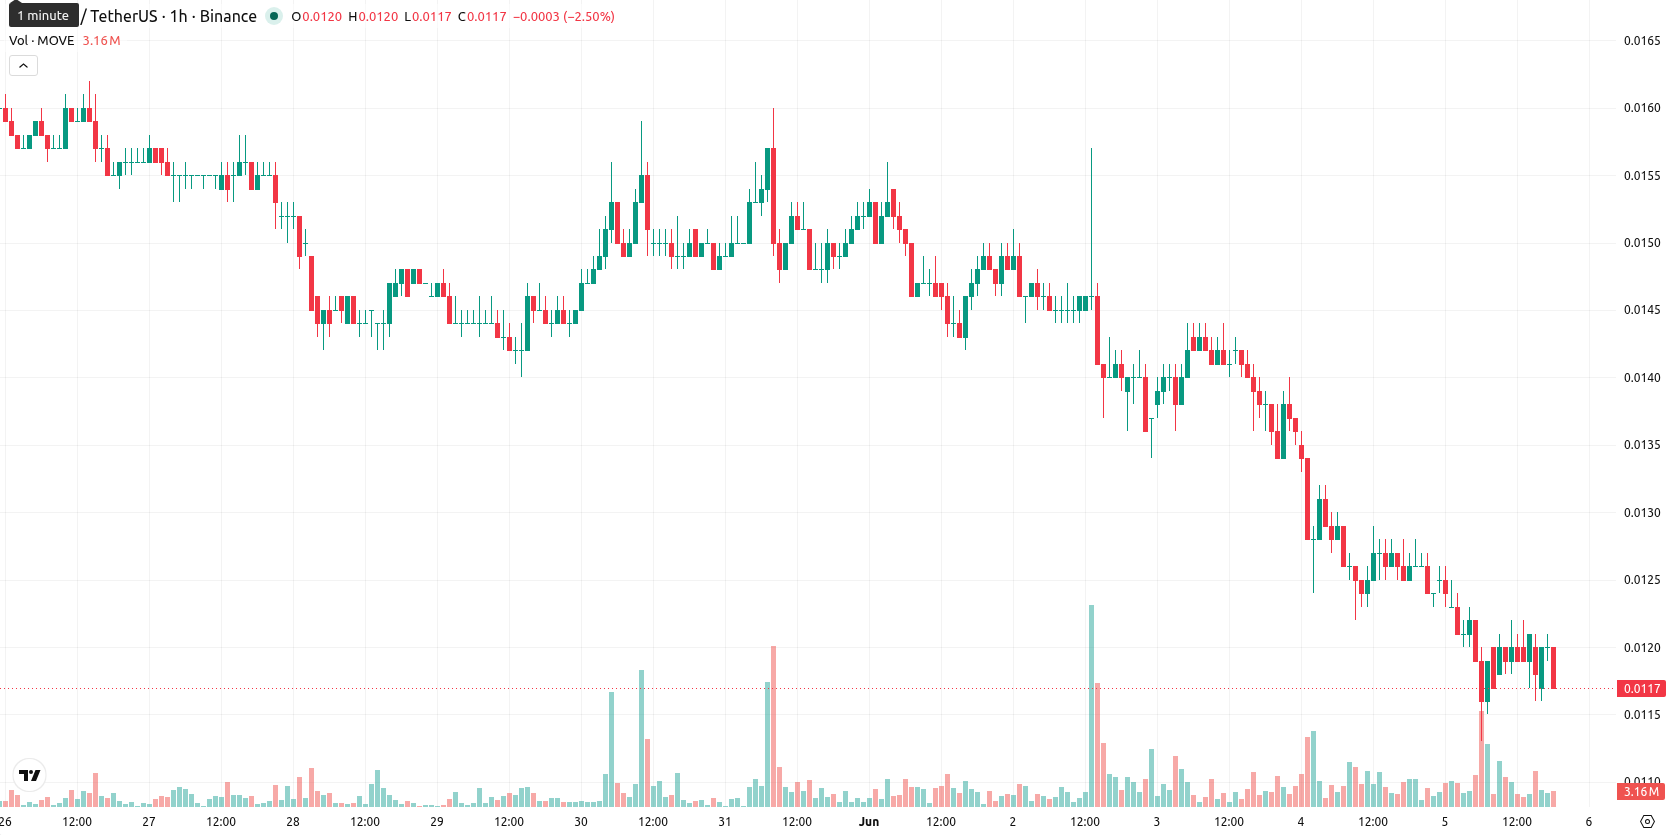
Movement (MOVE) is trading at $0.0117, down 7.14% on the day and experiencing high volatility. The asset is positioned below its key moving averages, indicating continued pressure from sellers.
 0.0123
0.0131
0.0123
0.0131
Highlights
- MOVE/USD remains under selling pressure, trading below key moving averages and signaling persistence of the broader bearish trend.
- Momentum indicators are predominantly negative, though mixed signals from oscillators introduce short-term uncertainty despite sellers having control.
- Expected trading range is $0.0109 to $0.0132 over the next two to three days, with a 28% chance of an upside move and pivot resistance at $0.0121.
Bearish momentum as technical signals diverge on hourly chart
On the hourly chart, MOVE/USD is trading below the MA-20 at $0.0120 and the MA-50 at $0.0126, with price also well below the long-term MA-200 at $0.0272. Immediate resistance is marked by the Ichimoku Kijun at $0.0121, while support is seen near $0.0109. Momentum indicators show strong negative readings: MACD signals a strong sell, ADX confirms sellers in control, and RSI sits at 44.87, implying further downside risk. Divergence among oscillators is notable, with Stoch RSI registering as overbought, CCI as neutral, and BBP giving a strong buy reading, while the Awesome Oscillator is currently neutral, highlighting mixed short-term sentiment.
Volatility persists as consolidation expected within trading range
In the short term, MOVE/USD is expected to fluctuate between $0.0109 and $0.0132, reflecting the current volatility band. The likelihood of an upward move is estimated at 28%, with the baseline scenario suggesting price consolidation within this range. A bullish outcome would require a breakout above the immediate $0.0121 resistance, while a sustained move below $0.0109 could trigger further downside.
Earlier, analysts noted that Movement maintained a bearish bias despite strategic shifts and operational expansion. Fresh technical signals and ongoing volatility in the current session reinforce downside risk, making sustained closes below $0.0109 an important trigger to monitor for potential further weakness.














-
 Afghanistan
-
 Albania
-
 Algeria
-
 Angola
-
 Argentina
-
 Armenia
-
 Australia
-
 Austria
-
 Azerbaijan
-
 Bahamas
-
 Bahrain
-
 Bangladesh
-
 Belarus
-
 Belgium
-
 Bolivia
-
 Botswana
-
 Brazil
-
 Brunei
-
 Bulgaria
-
 Cambodia
-
 Cameroon
-
 Canada
-
 Chile
Chile
-
 China
China
-
 Colombia
-
 Congo
Congo
-
 Costa Rica
-
 Cote d'Ivoire
-
 Croatia
-
 Cuba
Cuba
-
 Cyprus
-
 Czechia
-
 DR Congo
-
 Denmark
-
 Dominican Republic
-
 Ecuador
-
 Egypt
Egypt
-
 El Salvador
-
 Estonia
-
 Eswatini
-
 Ethiopia
-
 Finland
-
 France
-
 Georgia
-
 Germany
-
 Ghana
Ghana
-
 Greece
-
 Haiti
Haiti
-
 Hong Kong
-
 Hungary
-
 India
India
-
 Indonesia
-
 Iran, Islamic republic
-
 Iraq
Iraq
-
 Ireland
-
 Israel
-
 Italy
Italy
-
 Jamaica
-
 Japan
Japan
-
 Jordan
-
 Kazakhstan
-
 Kenya
Kenya
-
 Korea
Korea
-
 Kuwait
-
 Kyrgyzstan
-
 Laos
Laos
-
 Latvia
-
 Lebanon
-
 Lesotho
-
 Libya
Libya
-
 Lithuania
-
 Luxembourg
-
 Madagascar
-
 Malaysia
-
 Malta
Malta
-
 Mauritius
-
 Mexico
-
 Moldova
-
 Mongolia
-
 Montenegro
-
 Morocco
-
 Mozambique
-
 Myanmar
-
 Namibia
-
 Nepal
Nepal
-
 Netherlands
-
 New Zealand
-
 Nigeria
-
 North Macedonia
-
 Norway
-
 Oman
Oman
-
 Pakistan
-
 Palestine
-
 Panama
-
 Papua New Guinea
-
 Paraguay
-
 Peru
Peru
-
 Philippines
-
 Poland
-
 Portugal
-
 Puerto Rico
-
 Qatar
Qatar
-
 Reunion
-
 Romania
-
 Rwanda
-
 Saudi Arabia
-
 Serbia
-
 Singapore
-
 Slovakia
-
 Slovenia
-
 Somalia
-
 South Africa
-
 Spain
Spain
-
 Sri Lanka
-
 Sweden
-
 Switzerland
-
 Syria
Syria
-
 Taiwan
-
 Tajikistan
-
 Tanzania
-
 Thailand
-
 Trinidad and Tobago
-
 Tunisia
-
 Turkey
-
 UAE
UAE
-
 Uganda
-
 Ukraine
-
 United Kingdom
-
United States
-
 Uruguay
-
 Uzbekistan
-
 Venezuela
-
 Vietnam
-
 Yemen
Yemen
-
 Zambia
-
 Zimbabwe
- Forex
- Crypto











