
Starknet price prediction: Will $0.0351 resistance hold as STRK rises 4.46%?

Starknet (STRK) is trading at $0.0328, up 4.46% on the day and building further distance from its short- and medium-term moving averages. The token remains firmly below longer-term averages, underscoring a mixed trend across different timeframes.
 0.0293
0.0317
0.0293
0.0317
Highlights
- SithSwap's use of Starknet's zk-Rollup technology enhances security and trust for decentralized trading by batching transactions for Ethereum mainnet verification.
- Integration with major wallets and a no-KYC onboarding process, combined with OpenZeppelin-audited contracts, reduces barriers and operational risks in the Starknet ecosystem.
- STRK/USD demonstrates short- and medium-term bullish momentum with strong intraday buying, but overbought technical signals suggest a likely consolidation within the $0.0305–$0.0351 range over the next few days.
Ecosystem activity surges as network upgrades and audits bolster trust
SithSwap, a leading decentralized exchange operating on the Starknet network, is drawing attention for its low trading fees, minimal slippage, and enhanced security standards. By utilizing Starknet’s zk-Rollup technology, SithSwap enables user transactions to be batched and verified on the Ethereum mainnet, raising the security posture and reliability of on-chain activity. The integration of major wallets such as Argent X and Braavos, alongside a no-KYC process, further lowers barriers to user participation while OpenZeppelin's recent audit of smart contracts reduces operational risk. Together, these enhancements bolster utility, user confidence, and transactional flow within the Starknet ecosystem.
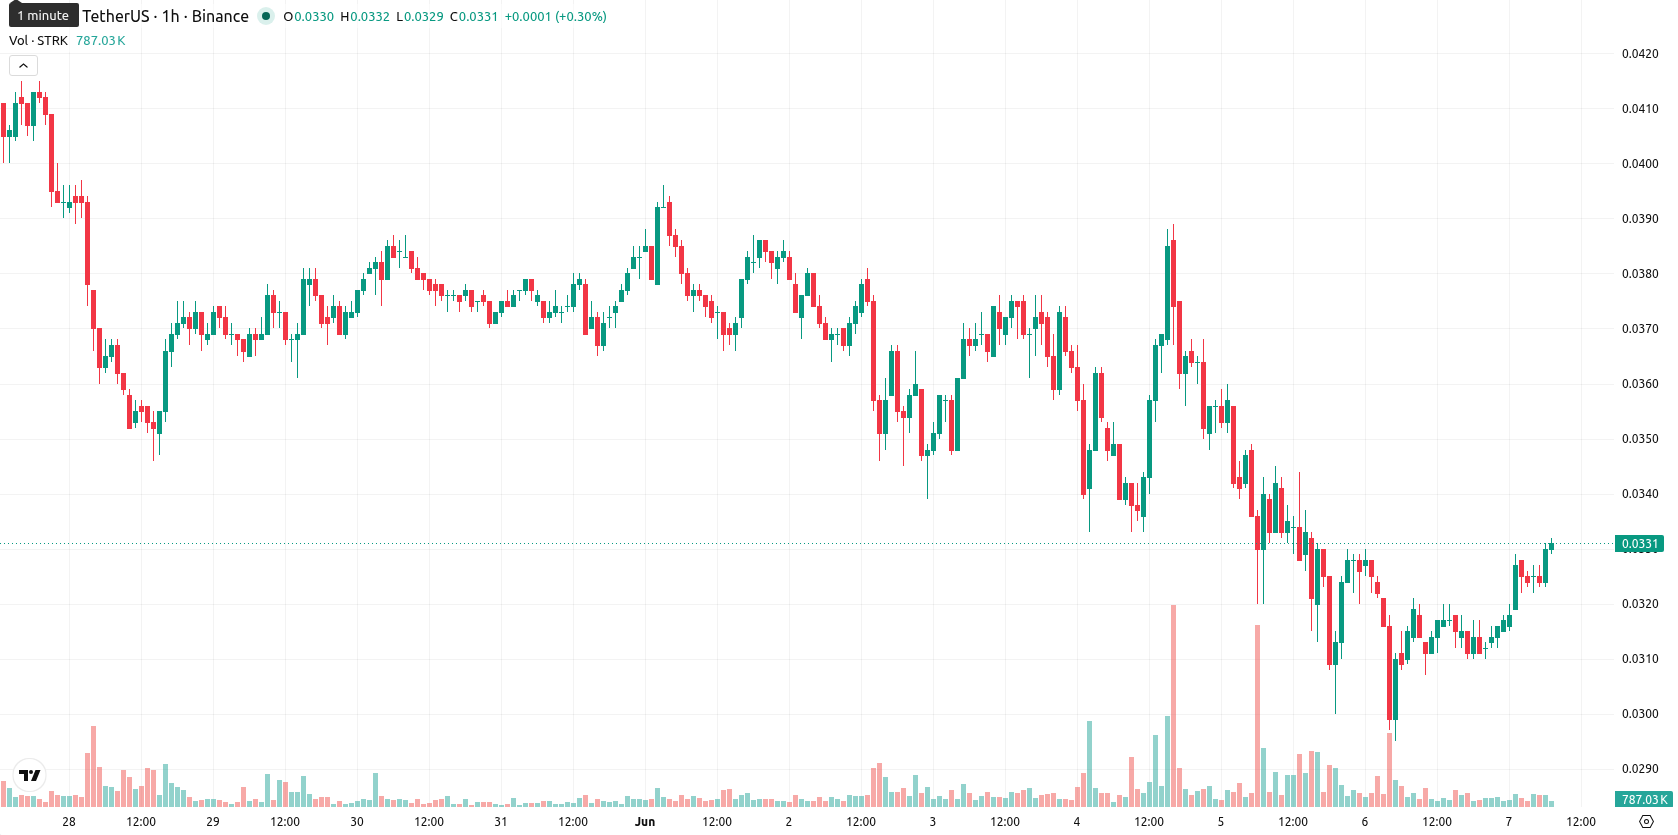
Upside momentum clashes with overbought signals near technical resistance
STRK/USD has crossed above the MA-20 at $0.0317 and MA-50 at $0.0322, but remains well beneath the MA-200 at $0.0626. The Ichimoku Kijun level at $0.0312 acts as immediate support. On the momentum side, the RSI is in bullish territory, while MACD and ADX are currently neutral. Stoch RSI and CCI indicate overbought conditions, suggesting potential for a near-term pause, though BBP reflects intraday buyer dominance. The Awesome Oscillator supports the active upward movement. Price action today included a 0.0002 gap and extended gains toward the top of the daily range, accompanied by elevated volatility. Divergence between momentum indicators and overbought readings suggests mixed signals for further upside.
Price likely to consolidate as breakout triggers shape near-term risk
In the short term, STRK/USD is expected to consolidate within a typical volatility band of $0.0305 to $0.0351 over the next two to three trading sessions. Baseline expectations point to stability inside this corridor, with a 53% probability of further upside continuation and a 47% chance of a downward move. Should resistance be broken, the price could see additional gains, while a slip below immediate support at the Kijun level may trigger renewed selling across the asset.
Earlier, analysts noted that Starknet (STRK) was entrenched in a bearish trend, with price action demonstrating persistent downside momentum. The current rebound above key short-term averages and improved ecosystem fundamentals suggest early signs of stabilization, making the $0.0305 support area pivotal for traders monitoring the next directional move.








-
 Afghanistan
-
 Albania
-
 Algeria
-
 Angola
-
 Argentina
-
 Armenia
-
 Australia
-
 Austria
-
 Azerbaijan
-
 Bahamas
-
 Bahrain
-
 Bangladesh
-
 Belarus
-
 Belgium
-
 Bolivia
-
 Botswana
-
 Brazil
-
 Brunei
-
 Bulgaria
-
 Cambodia
-
 Cameroon
-
 Canada
-
 Chile
Chile
-
 China
China
-
 Colombia
-
 Congo
Congo
-
 Costa Rica
-
 Cote d'Ivoire
-
 Croatia
-
 Cuba
Cuba
-
 Cyprus
-
 Czechia
-
 DR Congo
-
 Denmark
-
 Dominican Republic
-
 Ecuador
-
 Egypt
Egypt
-
 El Salvador
-
 Estonia
-
 Eswatini
-
 Ethiopia
-
 Finland
-
 France
-
 Georgia
-
 Germany
-
 Ghana
Ghana
-
 Greece
-
 Haiti
Haiti
-
 Hong Kong
-
 Hungary
-
 India
India
-
 Indonesia
-
 Iran, Islamic republic
-
 Iraq
Iraq
-
 Ireland
-
 Israel
-
 Italy
Italy
-
 Jamaica
-
 Japan
Japan
-
 Jordan
-
 Kazakhstan
-
 Kenya
Kenya
-
 Korea
Korea
-
 Kuwait
-
 Kyrgyzstan
-
 Laos
Laos
-
 Latvia
-
 Lebanon
-
 Lesotho
-
 Libya
Libya
-
 Lithuania
-
 Luxembourg
-
 Madagascar
-
 Malaysia
-
 Malta
Malta
-
 Mauritius
-
 Mexico
-
 Moldova
-
 Mongolia
-
 Montenegro
-
 Morocco
-
 Mozambique
-
 Myanmar
-
 Namibia
-
 Nepal
Nepal
-
 Netherlands
-
 New Zealand
-
 Nigeria
-
 North Macedonia
-
 Norway
-
 Oman
Oman
-
 Pakistan
-
 Palestine
-
 Panama
-
 Papua New Guinea
-
 Paraguay
-
 Peru
Peru
-
 Philippines
-
 Poland
-
 Portugal
-
 Puerto Rico
-
 Qatar
Qatar
-
 Reunion
-
 Romania
-
 Rwanda
-
 Saudi Arabia
-
 Serbia
-
 Singapore
-
 Slovakia
-
 Slovenia
-
 Somalia
-
 South Africa
-
 Spain
Spain
-
 Sri Lanka
-
 Sweden
-
 Switzerland
-
 Syria
Syria
-
 Taiwan
-
 Tajikistan
-
 Tanzania
-
 Thailand
-
 Trinidad and Tobago
-
 Tunisia
-
 Turkey
-
 UAE
UAE
-
 Uganda
-
 Ukraine
-
 United Kingdom
-
United States
-
 Uruguay
-
 Uzbekistan
-
 Venezuela
-
 Vietnam
-
 Yemen
Yemen
-
 Zambia
-
 Zimbabwe
- Forex
- Crypto












