
TRUMP gains 7.13% as price holds above short-term averages

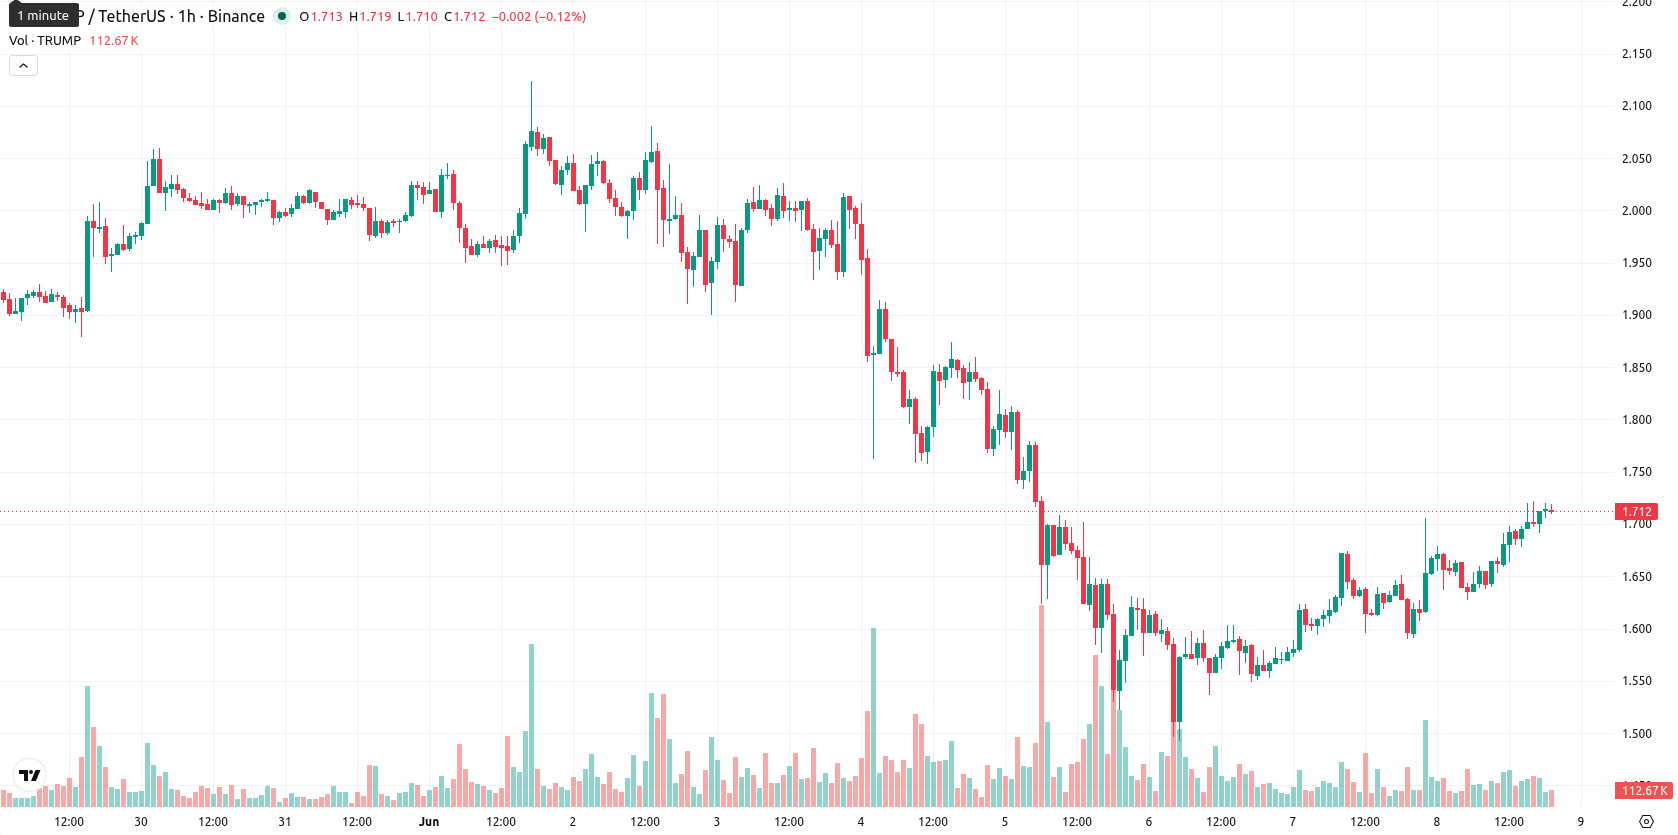
Official Trump (TRUMP) is trading at $1.71, reflecting a 7.13% gain from the previous session. TRUMP sits above its key moving averages on the intraday chart, signaling resilience in short-term price action.
 1.57
1.66
1.57
1.66
Highlights
- TRUMP/USD shows sustained short- and medium-term bullish momentum but remains in a long-term downtrend.
- Momentum indicators signal buyer dominance, yet multiple oscillators warn of overbought conditions and near-term exhaustion.
- Price is expected to consolidate between $1.58 and $1.84 over the next 2–3 days, with a 74% probability of further upside.
Momentum challenge emerges as bullish momentum meets overbought signals
On the technical front, TRUMP trades above the MA-20 ($1.67) and MA-50 ($1.63) on the h1 timeframe, but remains well below the long-term MA-200 ($3.79). Immediate support is identified at the Ichimoku Kijun level of $1.66. Momentum indicators remain strong, with MACD, ADX, and BBP all supporting continued buyer dominance. However, the RSI (67.65), Stoch RSI, and CCI all indicate overbought conditions, suggesting a risk of short-term exhaustion. The Awesome Oscillator further confirms intraday upward momentum, illustrating divergence between bullish directional momentum and cautionary signals from overbought oscillators.
Upside scenario seen as volatility defines trading range
Over the next two to three trading days, TRUMP is expected to consolidate within a typical volatility band between $1.58 and $1.84. The probability of further upside is estimated at 74%, while the downside risk is less pronounced at 26%. A bullish pricing scenario would involve a breakout above $1.84, whereas a break below support at $1.66 would open the door for a retracement toward the lower end of the projected range.
Previously it was reported that tensions surrounding a proposed compensation fund for Jan 6 defendants led to high-profile disputes involving President Trump and renewed focus on related political controversies. The current technical setup in TRUMP adds a new dimension to the narrative, with short-term momentum suggesting sustained buyer interest and making a breakout above $1.84 an actionable level for traders to monitor.


Latest TRUMP News







-
 Afghanistan
-
 Albania
-
 Algeria
-
 Angola
-
 Argentina
-
 Armenia
-
 Australia
-
 Austria
-
 Azerbaijan
-
 Bahamas
-
 Bahrain
-
 Bangladesh
-
 Belarus
-
 Belgium
-
 Bolivia
-
 Botswana
-
 Brazil
-
 Brunei
-
 Bulgaria
-
 Cambodia
-
 Cameroon
-
 Canada
-
 Chile
Chile
-
 China
China
-
 Colombia
-
 Congo
Congo
-
 Costa Rica
-
 Cote d'Ivoire
-
 Croatia
-
 Cuba
Cuba
-
 Cyprus
-
 Czechia
-
 DR Congo
-
 Denmark
-
 Dominican Republic
-
 Ecuador
-
 Egypt
Egypt
-
 El Salvador
-
 Estonia
-
 Eswatini
-
 Ethiopia
-
 Finland
-
 France
-
 Georgia
-
 Germany
-
 Ghana
Ghana
-
 Greece
-
 Haiti
Haiti
-
 Hong Kong
-
 Hungary
-
 India
India
-
 Indonesia
-
 Iran, Islamic republic
-
 Iraq
Iraq
-
 Ireland
-
 Israel
-
 Italy
Italy
-
 Jamaica
-
 Japan
Japan
-
 Jordan
-
 Kazakhstan
-
 Kenya
Kenya
-
 Korea
Korea
-
 Kuwait
-
 Kyrgyzstan
-
 Laos
Laos
-
 Latvia
-
 Lebanon
-
 Lesotho
-
 Libya
Libya
-
 Lithuania
-
 Luxembourg
-
 Madagascar
-
 Malaysia
-
 Malta
Malta
-
 Mauritius
-
 Mexico
-
 Moldova
-
 Mongolia
-
 Montenegro
-
 Morocco
-
 Mozambique
-
 Myanmar
-
 Namibia
-
 Nepal
Nepal
-
 Netherlands
-
 New Zealand
-
 Nigeria
-
 North Macedonia
-
 Norway
-
 Oman
Oman
-
 Pakistan
-
 Palestine
-
 Panama
-
 Papua New Guinea
-
 Paraguay
-
 Peru
Peru
-
 Philippines
-
 Poland
-
 Portugal
-
 Puerto Rico
-
 Qatar
Qatar
-
 Reunion
-
 Romania
-
 Rwanda
-
 Saudi Arabia
-
 Serbia
-
 Singapore
-
 Slovakia
-
 Slovenia
-
 Somalia
-
 South Africa
-
 Spain
Spain
-
 Sri Lanka
-
 Sweden
-
 Switzerland
-
 Syria
Syria
-
 Taiwan
-
 Tajikistan
-
 Tanzania
-
 Thailand
-
 Trinidad and Tobago
-
 Tunisia
-
 Turkey
-
 UAE
UAE
-
 Uganda
-
 Ukraine
-
 United Kingdom
-
United States
-
 Uruguay
-
 Uzbekistan
-
 Venezuela
-
 Vietnam
-
 Yemen
Yemen
-
 Zambia
-
 Zimbabwe
- Forex
- Crypto











