
Mixed signals complicate short-term direction for Movement after sharp upside move

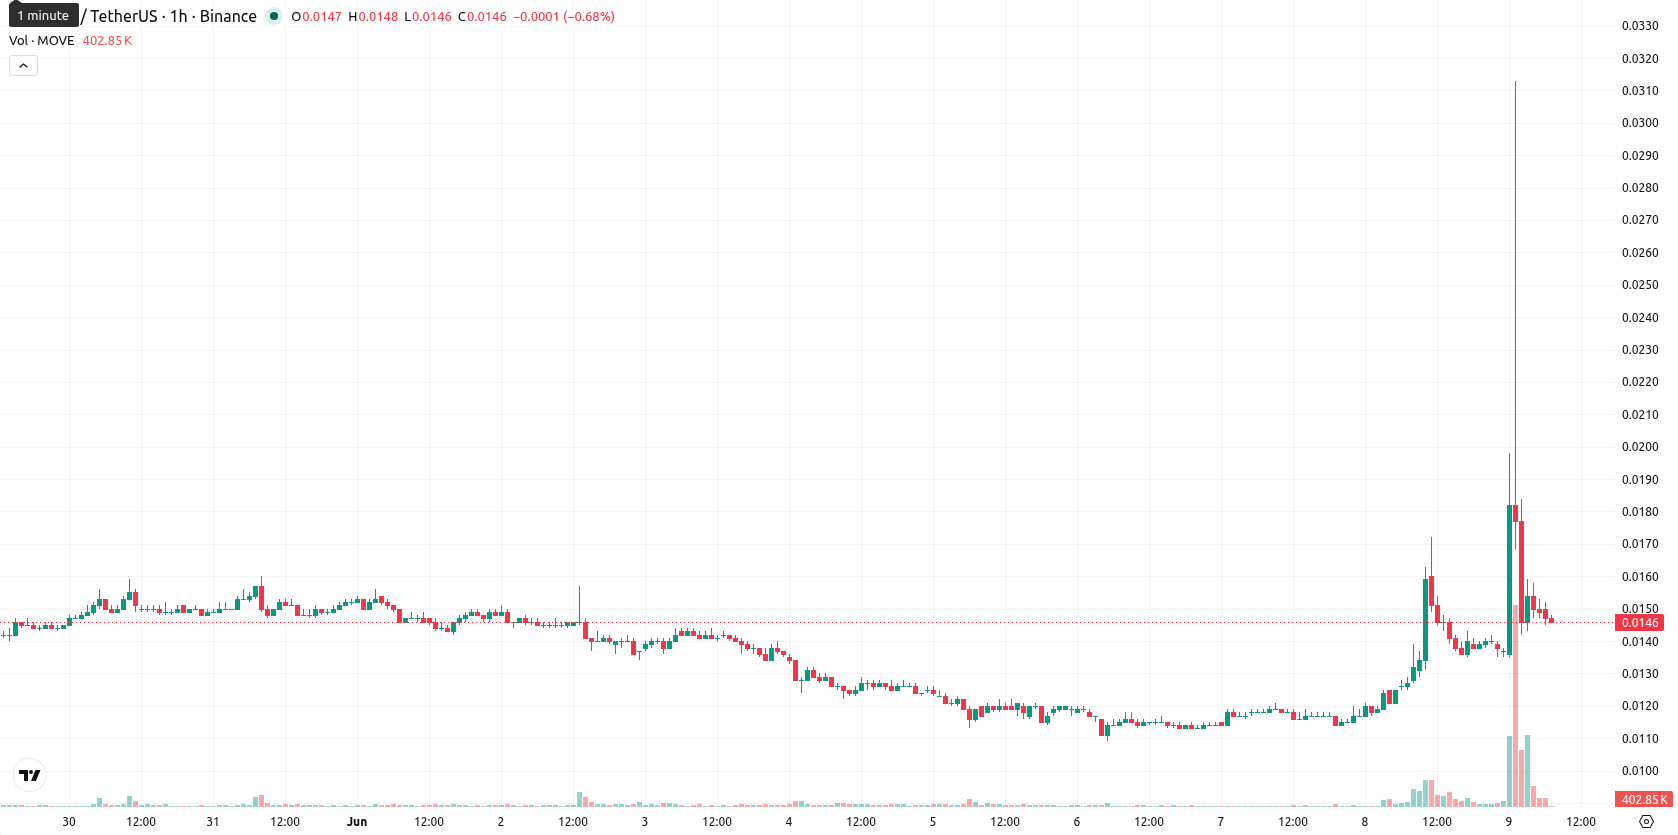
Movement (MOVE) is trading at $0.0148, showing a daily rise of 16.54%. The asset sits above its key short- and medium-term moving averages, reflecting notable intraday momentum.
 0.0123
0.0131
0.0123
0.0131
Highlights
- MOVE/USD displays short- and medium-term upside momentum, but remains in a longer-term downtrend with sellers retaining control.
- Mixed momentum signals and heightened volatility indicate uncertainty, as buyers lost ground after an initial strong advance.
- Price is expected to consolidate between $0.0134 and $0.0162 in the next few days, with a 77% probability of upward movement.
Indicator divergence complicates bullish bias despite resistance challenge
On the hourly chart, MOVE/USD trades above the MA-20 and MA-50 but remains below the MA-200, indicating that short- and medium-term moving average crossovers favor bullish action, while the longer-term trend remains unbroken. The Ichimoku Kijun at $0.0217 serves as immediate resistance. Oscillator readings are mixed: MACD shows a strong buy, ADX signals a buy, RSI reads 53 (buy), while Stoch RSI indicates oversold conditions, CCI remains neutral, BBP highlights intraday buyer dominance, and the Awesome Oscillator is neutral. Price action today included a gap up and a retreat to near session lows, suggesting that sellers have challenged the initial surge, and underlying momentum is complicated by indicator divergences.
Range consolidation likely as momentum favors upside breakout
In the short term, MOVE/USD is expected to oscillate within a volatility band from $0.0134 to $0.0162 over the next 2–3 trading days. The probability of an upward move through resistance stands at 77%, supported by recent momentum, while a break below support carries lower odds at 23%. The baseline scenario is range consolidation, with directional moves dependent on decisive shifts above resistance or below support levels.
Earlier, analysts noted that Movement was encountering mixed momentum signals, with buyer interest offset by unresolved bearish pressure. The current analysis strengthens that view by highlighting persistent indicator divergences amid intraday volatility, making a decisive break above the $0.0162 resistance crucial for a sustained directional move.














-
 Afghanistan
-
 Albania
-
 Algeria
-
 Angola
-
 Argentina
-
 Armenia
-
 Australia
-
 Austria
-
 Azerbaijan
-
 Bahamas
-
 Bahrain
-
 Bangladesh
-
 Belarus
-
 Belgium
-
 Bolivia
-
 Botswana
-
 Brazil
-
 Brunei
-
 Bulgaria
-
 Cambodia
-
 Cameroon
-
 Canada
-
 Chile
Chile
-
 China
China
-
 Colombia
-
 Congo
Congo
-
 Costa Rica
-
 Cote d'Ivoire
-
 Croatia
-
 Cuba
Cuba
-
 Cyprus
-
 Czechia
-
 DR Congo
-
 Denmark
-
 Dominican Republic
-
 Ecuador
-
 Egypt
Egypt
-
 El Salvador
-
 Estonia
-
 Eswatini
-
 Ethiopia
-
 Finland
-
 France
-
 Georgia
-
 Germany
-
 Ghana
Ghana
-
 Greece
-
 Haiti
Haiti
-
 Hong Kong
-
 Hungary
-
 India
India
-
 Indonesia
-
 Iran, Islamic republic
-
 Iraq
Iraq
-
 Ireland
-
 Israel
-
 Italy
Italy
-
 Jamaica
-
 Japan
Japan
-
 Jordan
-
 Kazakhstan
-
 Kenya
Kenya
-
 Korea
Korea
-
 Kuwait
-
 Kyrgyzstan
-
 Laos
Laos
-
 Latvia
-
 Lebanon
-
 Lesotho
-
 Libya
Libya
-
 Lithuania
-
 Luxembourg
-
 Madagascar
-
 Malaysia
-
 Malta
Malta
-
 Mauritius
-
 Mexico
-
 Moldova
-
 Mongolia
-
 Montenegro
-
 Morocco
-
 Mozambique
-
 Myanmar
-
 Namibia
-
 Nepal
Nepal
-
 Netherlands
-
 New Zealand
-
 Nigeria
-
 North Macedonia
-
 Norway
-
 Oman
Oman
-
 Pakistan
-
 Palestine
-
 Panama
-
 Papua New Guinea
-
 Paraguay
-
 Peru
Peru
-
 Philippines
-
 Poland
-
 Portugal
-
 Puerto Rico
-
 Qatar
Qatar
-
 Reunion
-
 Romania
-
 Rwanda
-
 Saudi Arabia
-
 Serbia
-
 Singapore
-
 Slovakia
-
 Slovenia
-
 Somalia
-
 South Africa
-
 Spain
Spain
-
 Sri Lanka
-
 Sweden
-
 Switzerland
-
 Syria
Syria
-
 Taiwan
-
 Tajikistan
-
 Tanzania
-
 Thailand
-
 Trinidad and Tobago
-
 Tunisia
-
 Turkey
-
 UAE
UAE
-
 Uganda
-
 Ukraine
-
 United Kingdom
-
United States
-
 Uruguay
-
 Uzbekistan
-
 Venezuela
-
 Vietnam
-
 Yemen
Yemen
-
 Zambia
-
 Zimbabwe
- Forex
- Crypto











