
NEAR slides as price dips below short-term averages, increasing downside risk

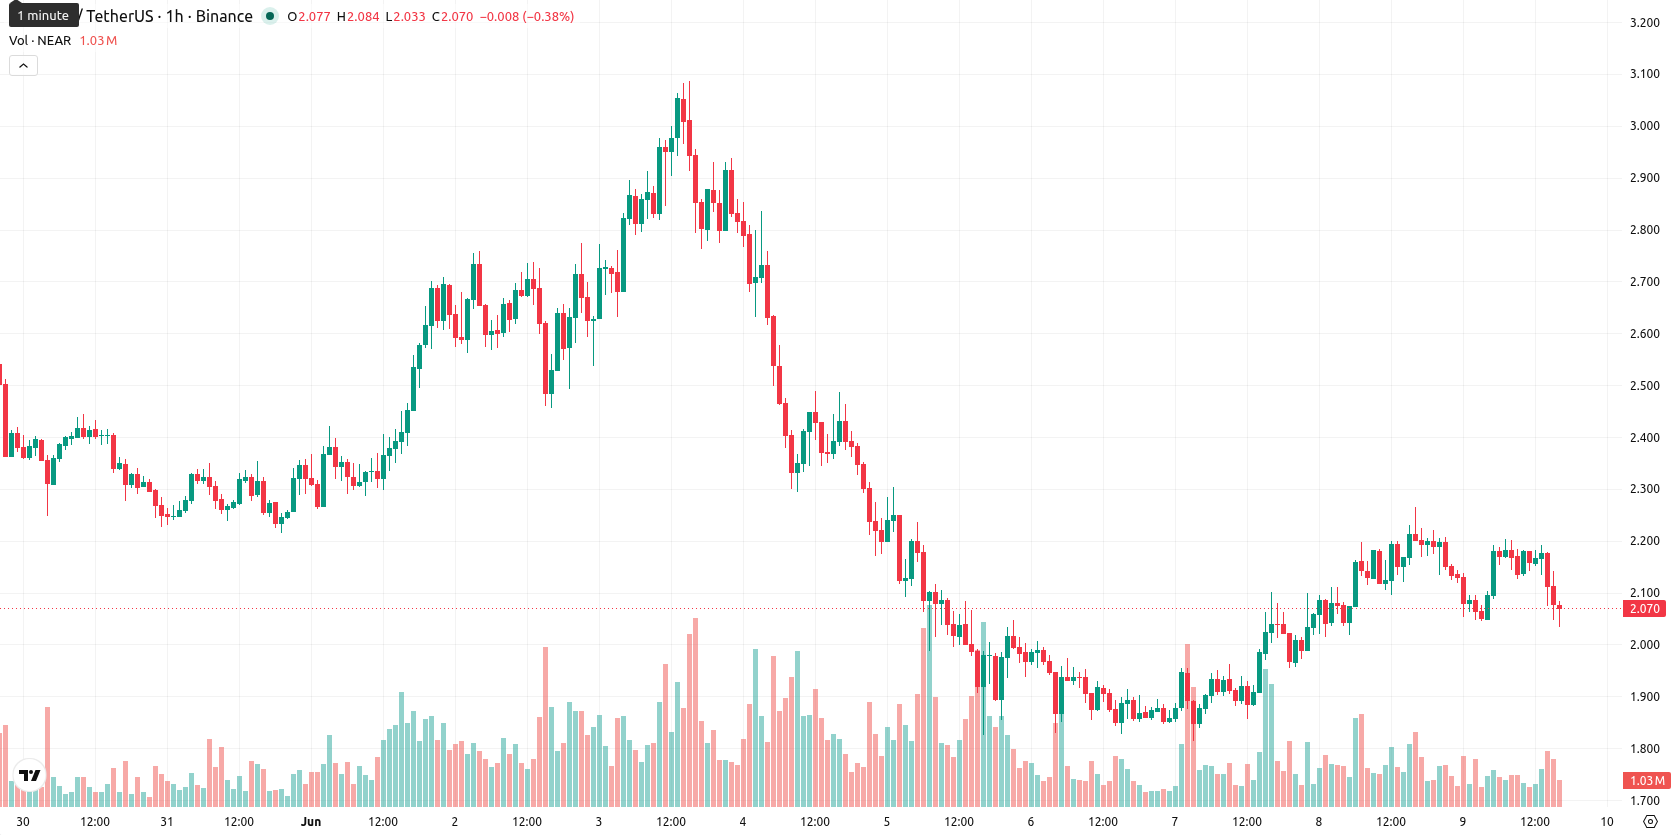
NEAR (NEAR) is trading at $2.0677 after a sharp daily decline of 7.53%. The move leaves NEAR below its key moving averages, with short-term momentum negative against a backdrop of heightened volatility.
Highlights
- NEAR exhibits persistent short- and medium-term bearish momentum as price trades below key moving averages.
- Momentum and oscillator signals are mixed, with some indicating oversold and others confirming further downside pressure.
- Projected trading range for NEAR is $1.7828 to $2.4346 in the next 2-3 days, with downside risk dominating unless $2.1550 resistance is breached.
Bearish traction as key averages breached and mixed signals persist
On the hourly chart, NEAR is trading below the MA-20 ($2.1338) and MA-50 ($2.1122), while still holding above the longer-term MA-200 at $1.5125. The Ichimoku Kijun serves as immediate resistance at $2.1550. Momentum indicators are mixed: MACD and ADX are neutral, RSI is at 40.82, and CCI signals a sell bias; Stoch RSI shows oversold conditions, and Bull/Bear Power (BBP) points to some buyer pressure intraday. In contrast, the Awesome Oscillator remains strongly bearish, reinforcing the bearish price action seen today.
Downside bias as resistance caps reversal potential
In the near term, NEAR is expected to trade within a volatility band between $1.7828 and $2.4346 over the next 2–3 days. Probability for an upside breakout is low (23%), favoring a continuation of the current downside move. The base case sees sideways consolidation; a break above $2.1550 (immediate resistance) could trigger a bullish scenario, while a move below support would likely accelerate losses toward the lower end of the forecast range.
Earlier, analysts noted that NEAR was displaying conflicting momentum signals amid increased volatility, reflecting indecision in the market's short-term direction. The latest downside break and shift in momentum indicators now place heightened focus on the potential for deeper losses if NEAR fails to hold above its longer-term support, with volatility likely to create trading opportunities for those prepared to act quickly.


Latest NEAR News


-
 Afghanistan
-
 Albania
-
 Algeria
-
 Angola
-
 Argentina
-
 Armenia
-
 Australia
-
 Austria
-
 Azerbaijan
-
 Bahamas
-
 Bahrain
-
 Bangladesh
-
 Belarus
-
 Belgium
-
 Bolivia
-
 Botswana
-
 Brazil
-
 Brunei
-
 Bulgaria
-
 Cambodia
-
 Cameroon
-
 Canada
-
 Chile
Chile
-
 China
China
-
 Colombia
-
 Congo
Congo
-
 Costa Rica
-
 Cote d'Ivoire
-
 Croatia
-
 Cuba
Cuba
-
 Cyprus
-
 Czechia
-
 DR Congo
-
 Denmark
-
 Dominican Republic
-
 Ecuador
-
 Egypt
Egypt
-
 El Salvador
-
 Estonia
-
 Eswatini
-
 Ethiopia
-
 Finland
-
 France
-
 Georgia
-
 Germany
-
 Ghana
Ghana
-
 Greece
-
 Haiti
Haiti
-
 Hong Kong
-
 Hungary
-
 India
India
-
 Indonesia
-
 Iran, Islamic republic
-
 Iraq
Iraq
-
 Ireland
-
 Israel
-
 Italy
Italy
-
 Jamaica
-
 Japan
Japan
-
 Jordan
-
 Kazakhstan
-
 Kenya
Kenya
-
 Korea
Korea
-
 Kuwait
-
 Kyrgyzstan
-
 Laos
Laos
-
 Latvia
-
 Lebanon
-
 Lesotho
-
 Libya
Libya
-
 Lithuania
-
 Luxembourg
-
 Madagascar
-
 Malaysia
-
 Malta
Malta
-
 Mauritius
-
 Mexico
-
 Moldova
-
 Mongolia
-
 Montenegro
-
 Morocco
-
 Mozambique
-
 Myanmar
-
 Namibia
-
 Nepal
Nepal
-
 Netherlands
-
 New Zealand
-
 Nigeria
-
 North Macedonia
-
 Norway
-
 Oman
Oman
-
 Pakistan
-
 Palestine
-
 Panama
-
 Papua New Guinea
-
 Paraguay
-
 Peru
Peru
-
 Philippines
-
 Poland
-
 Portugal
-
 Puerto Rico
-
 Qatar
Qatar
-
 Reunion
-
 Romania
-
 Rwanda
-
 Saudi Arabia
-
 Serbia
-
 Singapore
-
 Slovakia
-
 Slovenia
-
 Somalia
-
 South Africa
-
 Spain
Spain
-
 Sri Lanka
-
 Sweden
-
 Switzerland
-
 Syria
Syria
-
 Taiwan
-
 Tajikistan
-
 Tanzania
-
 Thailand
-
 Trinidad and Tobago
-
 Tunisia
-
 Turkey
-
 UAE
UAE
-
 Uganda
-
 Ukraine
-
 United Kingdom
-
United States
-
 Uruguay
-
 Uzbekistan
-
 Venezuela
-
 Vietnam
-
 Yemen
Yemen
-
 Zambia
-
 Zimbabwe
- Forex
- Crypto
