
BTC consolidates in volatile seven-day range as RSI dips to 33.19: weekly report

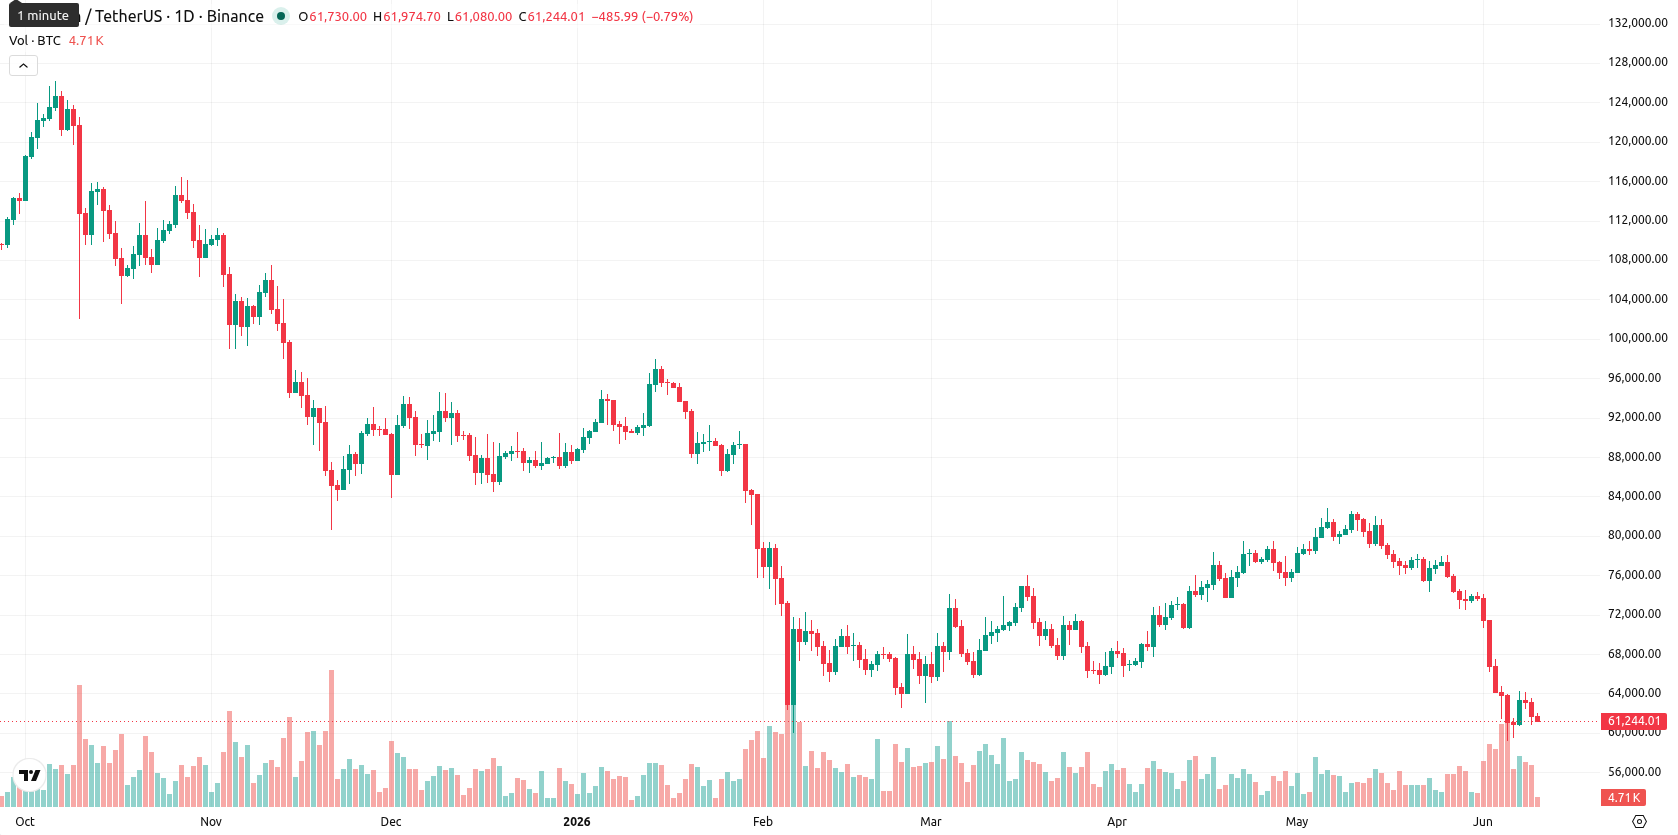
Bitcoin (BTC) is trading at $61,273.59 after dropping $5,747.60 (8.53%) over the past week. The asset sits convincingly below its weekly MA-20 ($71,425.48), MA-50 ($91,727.09), and just under the MA-200 ($62,014.28), highlighting pronounced sustained selling pressure and placing the MA-200 as the closest dynamic support.
Highlights
- Bitcoin is trading below all key weekly moving averages, indicating sustained medium- and long-term selling pressure.
- Momentum indicators collectively signal an oversold and firmly bearish environment, reinforcing the likelihood of further declines.
- Expected price action will likely consolidate in the $58,200–$64,400 range, with a break below $58,200 risking new annual lows.
Corporate accumulation and regulatory developments shape weekly sentiment
Bitcoin saw robust corporate accumulation activity, with Strategy Inc. increasing its holdings by 1,550 BTC from June 1 through June 7, taking its total to over 818,000 BTC. Additional sizeable reserves were publicly disclosed by Hyperscale Data and SpaceX. Regulatory momentum continued as the U.S. Congress is reviewing the H.R. 8957 - ARMA bill to establish a federal Bitcoin reserve with strict public audit requirements. Circle also introduced cirBTC, a fully BTC-backed token on Ethereum to boost institutional DeFi access.
Persistent downside momentum confirmed by weekly indicators and volatility
On the weekly chart, Bitcoin is firmly below the MA-20, MA-50, and slightly under the MA-200, signaling strong medium- and long-term downward momentum, with the MA-200 acting as immediate support. Weekly indicators reinforce bearish conditions: MACD sits at -6,357.93, ADX at 24.61 underscores a persistent downside bias, RSI is 33.19, CCI stands at -138.28, and Stochastic RSI is heavily oversold at 6.90. Bull/Bear Power and the Awesome Oscillator confirm dominant selling pressure, while price action remains in the lower segment of the weekly range amidst high volatility of 9.53%. Key support is at $58,200, with resistance capped near $64,400.
Consolidation favored over the week amid low rebound prospects
For the next 7 days, price is anticipated to consolidate within a range of $58,200 to $64,400, reflecting prevalent bearish sentiment and sustained volatility. The probability of a rebound remains very low, with none of the weekly indicators suggesting a buy. Continued sideways movement within this corridor is most likely, while a break below $58,200 could accelerate further declines toward new yearly lows. Any bullish reversal would require a convincing close above $64,400, which current momentum does not support.
Earlier, analysts noted that El Salvador’s five-year bitcoin experiment has evolved to focus less on mandatory payments and more on institutional reserves, education, and strategic positioning amid ongoing international scrutiny. The current price action, shaped by significant selling pressure and robust corporate accumulation, underscores the importance of monitoring the $58,200 support level for signs of potential further downside or stabilization in the week ahead.


Latest Bitcoin News


-
 Afghanistan
-
 Albania
-
 Algeria
-
 Angola
-
 Argentina
-
 Armenia
-
 Australia
-
 Austria
-
 Azerbaijan
-
 Bahamas
-
 Bahrain
-
 Bangladesh
-
 Belarus
-
 Belgium
-
 Bolivia
-
 Botswana
-
 Brazil
-
 Brunei
-
 Bulgaria
-
 Cambodia
-
 Cameroon
-
 Canada
-
 Chile
Chile
-
 China
China
-
 Colombia
-
 Congo
Congo
-
 Costa Rica
-
 Cote d'Ivoire
-
 Croatia
-
 Cuba
Cuba
-
 Cyprus
-
 Czechia
-
 DR Congo
-
 Denmark
-
 Dominican Republic
-
 Ecuador
-
 Egypt
Egypt
-
 El Salvador
-
 Estonia
-
 Eswatini
-
 Ethiopia
-
 Finland
-
 France
-
 Georgia
-
 Germany
-
 Ghana
Ghana
-
 Greece
-
 Haiti
Haiti
-
 Hong Kong
-
 Hungary
-
 India
India
-
 Indonesia
-
 Iran, Islamic republic
-
 Iraq
Iraq
-
 Ireland
-
 Israel
-
 Italy
Italy
-
 Jamaica
-
 Japan
Japan
-
 Jordan
-
 Kazakhstan
-
 Kenya
Kenya
-
 Korea
Korea
-
 Kuwait
-
 Kyrgyzstan
-
 Laos
Laos
-
 Latvia
-
 Lebanon
-
 Lesotho
-
 Libya
Libya
-
 Lithuania
-
 Luxembourg
-
 Madagascar
-
 Malaysia
-
 Malta
Malta
-
 Mauritius
-
 Mexico
-
 Moldova
-
 Mongolia
-
 Montenegro
-
 Morocco
-
 Mozambique
-
 Myanmar
-
 Namibia
-
 Nepal
Nepal
-
 Netherlands
-
 New Zealand
-
 Nigeria
-
 North Macedonia
-
 Norway
-
 Oman
Oman
-
 Pakistan
-
 Palestine
-
 Panama
-
 Papua New Guinea
-
 Paraguay
-
 Peru
Peru
-
 Philippines
-
 Poland
-
 Portugal
-
 Puerto Rico
-
 Qatar
Qatar
-
 Reunion
-
 Romania
-
 Rwanda
-
 Saudi Arabia
-
 Serbia
-
 Singapore
-
 Slovakia
-
 Slovenia
-
 Somalia
-
 South Africa
-
 Spain
Spain
-
 Sri Lanka
-
 Sweden
-
 Switzerland
-
 Syria
Syria
-
 Taiwan
-
 Tajikistan
-
 Tanzania
-
 Thailand
-
 Trinidad and Tobago
-
 Tunisia
-
 Turkey
-
 UAE
UAE
-
 Uganda
-
 Ukraine
-
 United Kingdom
-
United States
-
 Uruguay
-
 Uzbekistan
-
 Venezuela
-
 Vietnam
-
 Yemen
Yemen
-
 Zambia
-
 Zimbabwe
- Forex
- Crypto
