
+4.86% for Pendle as overbought signals prompt vigilance near current levels

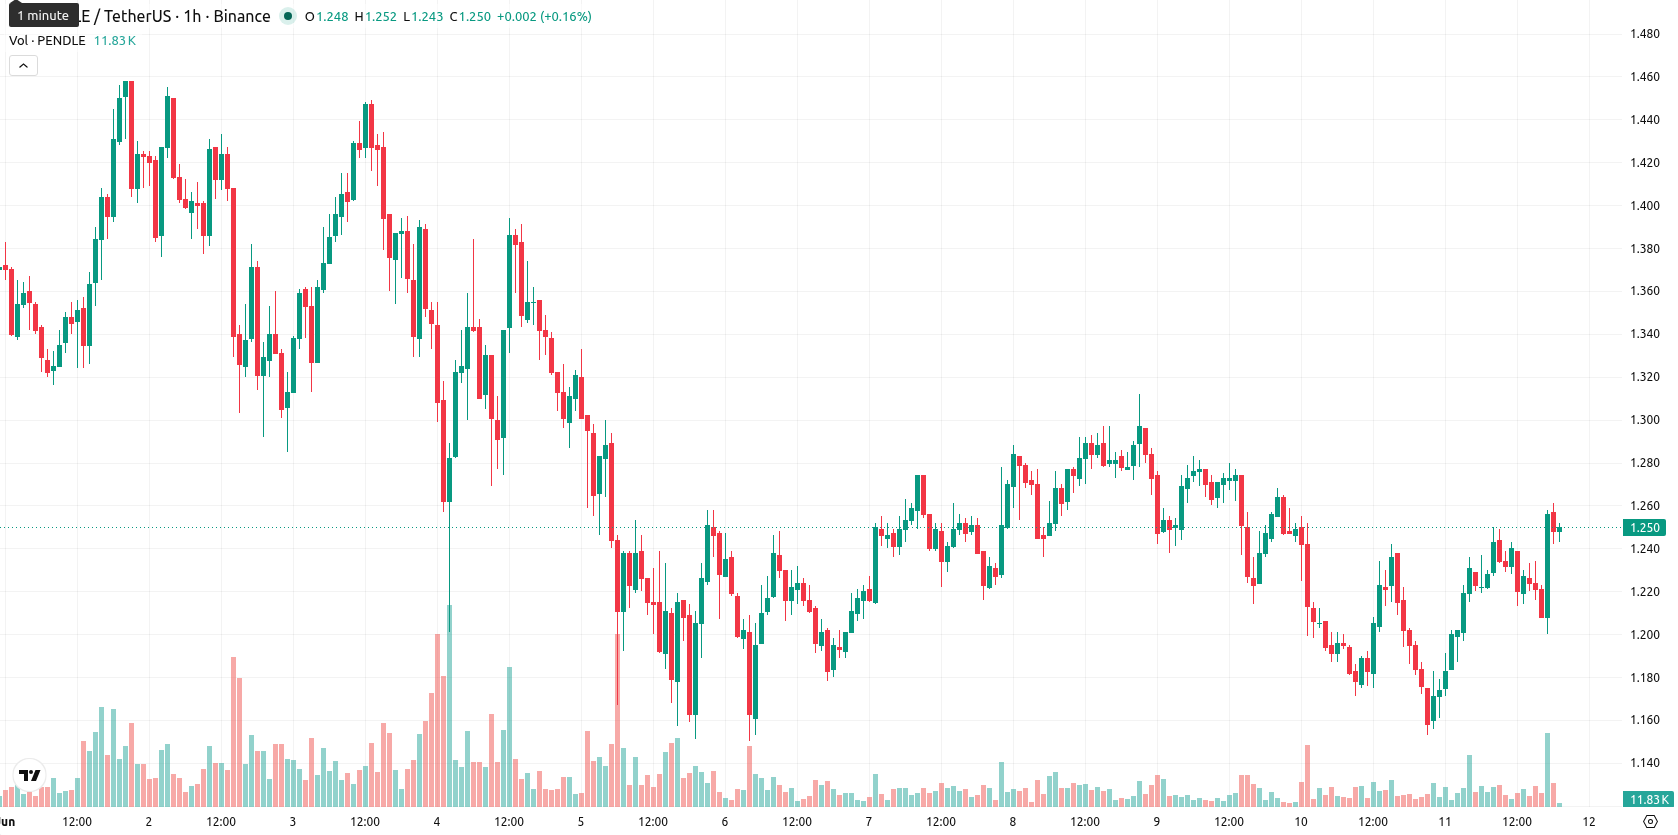
Pendle (PENDLE) is trading at $1.251, up 4.86% on the day. The asset is currently positioned above its key short- and medium-term moving averages, with momentum supported by strong buying activity.
Highlights
- Pendle demonstrates positive short- and medium-term momentum, but remains constrained by a bearish long-term structure.
- Buy signals from most momentum indicators contrast with overbought readings, implying potential near-term exhaustion despite strong demand.
- For the next 2–3 days, Pendle is expected to trade between $1.1860 and $1.2919, with a 71% probability of upside movement barring a break below immediate support.
Buyer lead clashes with overbought signals amid high volatility
MA-20 is at $1.2219 and MA-50 at $1.2149, with the price remaining below the long-term MA-200 at $1.6405. The Ichimoku Kijun sits at $1.2070, acting as immediate support. Momentum signals are mixed: MACD issues a Buy signal, ADX is Neutral, and RSI at 60 also shows Buy conditions. Both Stoch RSI and CCI are overbought, indicating near-term exhaustion, while BBP signals buyers still dominate intraday. The price is near today's high of $1.2510, accompanied by high volatility and a minor negative gap. This setup reveals a divergence between strong buyer momentum and overbought oscillator readings.
Sideways bias dominates as breakout risks shape short-term outlook
Over the next 2–3 trading days, PENDLE is expected to range between $1.1860 and $1.2919, reflecting a typical volatility band relative to current levels. The probability of an upward move is estimated at 71%, with a baseline scenario of sideways movement between support and resistance. A bullish breakout could occur if price closes above $1.2919, while a bearish move would require a drop below immediate support near the Kijun level.
Earlier, analysts noted that Pendle was under persistent bearish momentum despite steady protocol adoption. The recent shift to stronger buyer activity and improving technicals suggests that a sustained close above $1.2919 could mark a decisive change in short-term market direction.


-
 Afghanistan
-
 Albania
-
 Algeria
-
 Angola
-
 Argentina
-
 Armenia
-
 Australia
-
 Austria
-
 Azerbaijan
-
 Bahamas
-
 Bahrain
-
 Bangladesh
-
 Belarus
-
 Belgium
-
 Bolivia
-
 Botswana
-
 Brazil
-
 Brunei
-
 Bulgaria
-
 Cambodia
-
 Cameroon
-
 Canada
-
 Chile
Chile
-
 China
China
-
 Colombia
-
 Congo
Congo
-
 Costa Rica
-
 Cote d'Ivoire
-
 Croatia
-
 Cuba
Cuba
-
 Cyprus
-
 Czechia
-
 DR Congo
-
 Denmark
-
 Dominican Republic
-
 Ecuador
-
 Egypt
Egypt
-
 El Salvador
-
 Estonia
-
 Eswatini
-
 Ethiopia
-
 Finland
-
 France
-
 Georgia
-
 Germany
-
 Ghana
Ghana
-
 Greece
-
 Haiti
Haiti
-
 Hong Kong
-
 Hungary
-
 India
India
-
 Indonesia
-
 Iran, Islamic republic
-
 Iraq
Iraq
-
 Ireland
-
 Israel
-
 Italy
Italy
-
 Jamaica
-
 Japan
Japan
-
 Jordan
-
 Kazakhstan
-
 Kenya
Kenya
-
 Korea
Korea
-
 Kuwait
-
 Kyrgyzstan
-
 Laos
Laos
-
 Latvia
-
 Lebanon
-
 Lesotho
-
 Libya
Libya
-
 Lithuania
-
 Luxembourg
-
 Madagascar
-
 Malaysia
-
 Malta
Malta
-
 Mauritius
-
 Mexico
-
 Moldova
-
 Mongolia
-
 Montenegro
-
 Morocco
-
 Mozambique
-
 Myanmar
-
 Namibia
-
 Nepal
Nepal
-
 Netherlands
-
 New Zealand
-
 Nigeria
-
 North Macedonia
-
 Norway
-
 Oman
Oman
-
 Pakistan
-
 Palestine
-
 Panama
-
 Papua New Guinea
-
 Paraguay
-
 Peru
Peru
-
 Philippines
-
 Poland
-
 Portugal
-
 Puerto Rico
-
 Qatar
Qatar
-
 Reunion
-
 Romania
-
 Rwanda
-
 Saudi Arabia
-
 Serbia
-
 Singapore
-
 Slovakia
-
 Slovenia
-
 Somalia
-
 South Africa
-
 Spain
Spain
-
 Sri Lanka
-
 Sweden
-
 Switzerland
-
 Syria
Syria
-
 Taiwan
-
 Tajikistan
-
 Tanzania
-
 Thailand
-
 Trinidad and Tobago
-
 Tunisia
-
 Turkey
-
 UAE
UAE
-
 Uganda
-
 Ukraine
-
 United Kingdom
-
United States
-
 Uruguay
-
 Uzbekistan
-
 Venezuela
-
 Vietnam
-
 Yemen
Yemen
-
 Zambia
-
 Zimbabwe
- Forex
- Crypto
