
Celestia closes near upper end of recent range amid heightened volatility: weekly analysis

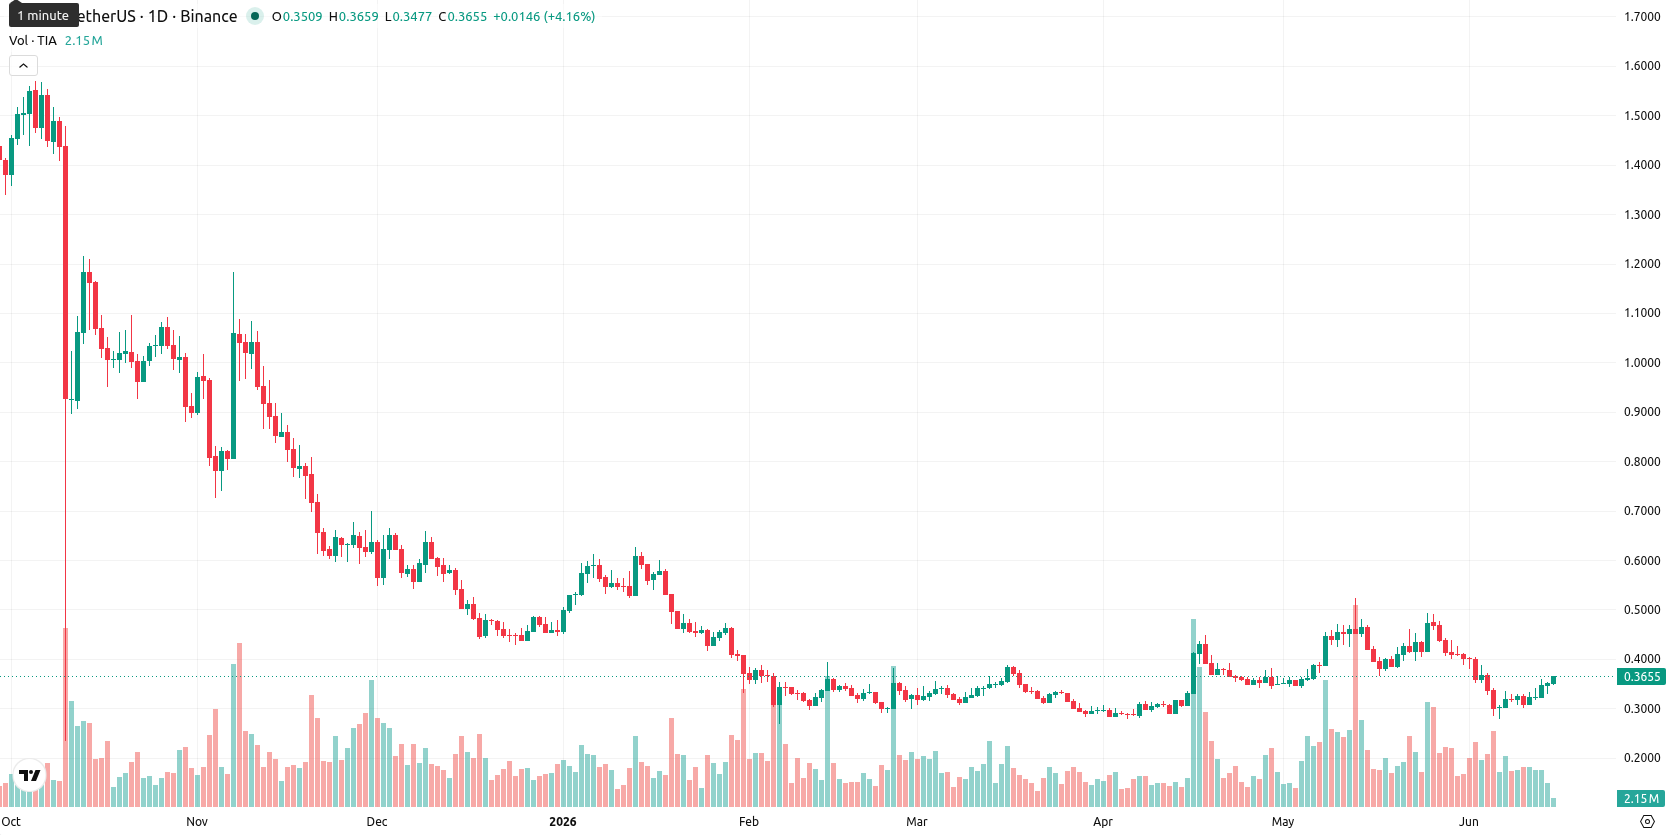
Celestia (TIA) closed the week at $0.3648, gaining $0.0502 or 16.18% over the last 7 days. The asset is trading slightly above its MA-20 ($0.3451) on the weekly chart, but remains well below both the MA-50 ($0.8531) and MA-200 ($0.4878), underscoring persistent medium- and long-term bearish momentum despite a recent short-term recovery.
Highlights
- TIA trades above near-term support but remains below medium- and long-term trend averages, reflecting market pressure.
- Momentum and trend indicators stay bearish, with oscillators signaling recovery attempts amid ongoing seller dominance.
- Expected 7-day price range is $0.2980 to $0.3700, with a probable stabilization as upside breakout odds remain low.
Seller dominance and mixed momentum as price stabilizes above MA-20
Weekly technicals for TIA on the W1 timeframe present a mixed picture. The price is showing stabilization above the MA-20, whereas MA-50 and MA-200 continue to signal overhead resistance and a seller-biased trend. Momentum indicators on W1, including a bearish MACD and ADX, highlight persistent downside momentum; RSI remains subdued in the lower range, and while Stochastic RSI hints at potential upside, it is nearly overbought. CCI is neutral, and Bull/Bear Power points toward a week dominated by sellers, despite the asset closing at the upper end of its weekly range on heightened volatility of 19.33%.
Sideways bias seen as technical resistance caps upside in coming week
For the next 7 days, TIA is forecast to stabilize within the $0.2980 to $0.3700 range, given ongoing volatility and lack of buy signals across key weekly indicators. The baseline scenario is for sideways action, holding between $0.30 and $0.37 as technical resistance remains prominent. In the event of renewed bullish momentum, a move above $0.37 could trigger higher lows, but the probability of a strong upward breakout is under 20%. A decline below $0.30 would reinforce bearish dominance and expose recent lows.
Earlier, analysts noted that Celestia was entering a period of growing buyer interest, buoyed by emerging bullish momentum and institutional validation of its modular architecture. The current outlook, however, reflects persistent seller control and range-bound trading, suggesting participants should closely watch the $0.37 resistance level for signs of either renewed upside momentum or further consolidation.


Latest Celestia News


-
 Afghanistan
-
 Albania
-
 Algeria
-
 Angola
-
 Argentina
-
 Armenia
-
 Australia
-
 Austria
-
 Azerbaijan
-
 Bahamas
-
 Bahrain
-
 Bangladesh
-
 Belarus
-
 Belgium
-
 Bolivia
-
 Botswana
-
 Brazil
-
 Brunei
-
 Bulgaria
-
 Cambodia
-
 Cameroon
-
 Canada
-
 Chile
Chile
-
 China
China
-
 Colombia
-
 Congo
Congo
-
 Costa Rica
-
 Cote d'Ivoire
-
 Croatia
-
 Cuba
Cuba
-
 Cyprus
-
 Czechia
-
 DR Congo
-
 Denmark
-
 Dominican Republic
-
 Ecuador
-
 Egypt
Egypt
-
 El Salvador
-
 Estonia
-
 Eswatini
-
 Ethiopia
-
 Finland
-
 France
-
 Georgia
-
 Germany
-
 Ghana
Ghana
-
 Greece
-
 Haiti
Haiti
-
 Hong Kong
-
 Hungary
-
 India
India
-
 Indonesia
-
 Iran, Islamic republic
-
 Iraq
Iraq
-
 Ireland
-
 Israel
-
 Italy
Italy
-
 Jamaica
-
 Japan
Japan
-
 Jordan
-
 Kazakhstan
-
 Kenya
Kenya
-
 Korea
Korea
-
 Kuwait
-
 Kyrgyzstan
-
 Laos
Laos
-
 Latvia
-
 Lebanon
-
 Lesotho
-
 Libya
Libya
-
 Lithuania
-
 Luxembourg
-
 Madagascar
-
 Malaysia
-
 Malta
Malta
-
 Mauritius
-
 Mexico
-
 Moldova
-
 Mongolia
-
 Montenegro
-
 Morocco
-
 Mozambique
-
 Myanmar
-
 Namibia
-
 Nepal
Nepal
-
 Netherlands
-
 New Zealand
-
 Nigeria
-
 North Macedonia
-
 Norway
-
 Oman
Oman
-
 Pakistan
-
 Palestine
-
 Panama
-
 Papua New Guinea
-
 Paraguay
-
 Peru
Peru
-
 Philippines
-
 Poland
-
 Portugal
-
 Puerto Rico
-
 Qatar
Qatar
-
 Reunion
-
 Romania
-
 Rwanda
-
 Saudi Arabia
-
 Serbia
-
 Singapore
-
 Slovakia
-
 Slovenia
-
 Somalia
-
 South Africa
-
 Spain
Spain
-
 Sri Lanka
-
 Sweden
-
 Switzerland
-
 Syria
Syria
-
 Taiwan
-
 Tajikistan
-
 Tanzania
-
 Thailand
-
 Trinidad and Tobago
-
 Tunisia
-
 Turkey
-
 UAE
UAE
-
 Uganda
-
 Ukraine
-
 United Kingdom
-
United States
-
 Uruguay
-
 Uzbekistan
-
 Venezuela
-
 Vietnam
-
 Yemen
Yemen
-
 Zambia
-
 Zimbabwe
- Forex
- Crypto
