
Celestia price prediction: Can $0.3688 resistance hold as TIA gains 7.33%?

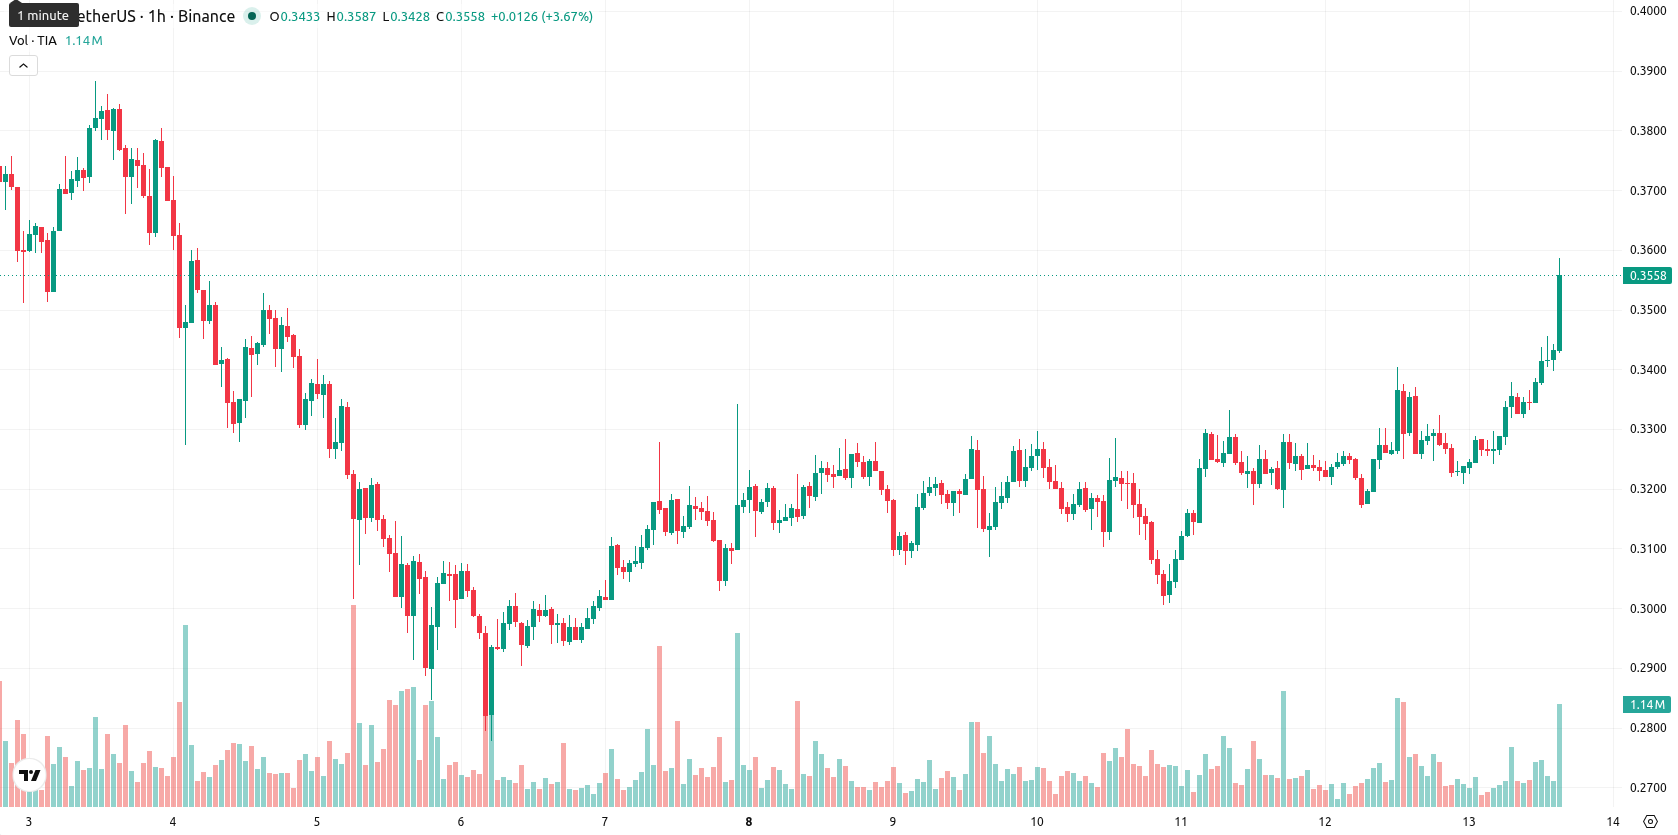
Celestia (TIA) is trading at $0.3558, up 7.33% on the day and sitting near the top of its daily range. The price is above its key short- and medium-term moving averages, indicating currently strong momentum.
Highlights
- Celestia's modular blockchain architecture is drawing increased enterprise adoption due to its scalable and interoperable design recognized as foundational for next-generation financial infrastructure.
- The growing institutional interest stems from Celestia's strategy of separating execution, consensus, and data availability, boosting its market momentum.
- TIA/USD shows strong short- and medium-term bullish momentum with high intraday volatility, expected to consolidate between $0.3469 and $0.3688, with immediate support at $0.3331 and predominant buy signals across key technical indicators.
Enterprise interest rises as modular design gains institutional validation
Celestia's modular blockchain architecture has been recognized by antier.com as foundational to the evolution of next-generation financial infrastructure, with its technical design enabling scalable and interoperable systems. This recognition validates Celestia's strategy of separating execution, consensus, and data availability, attracting increased attention from enterprise stakeholders. As institutional and industry players seek scalable solutions, the elevated profile of Celestia's framework is increasing market interest and adoption momentum.
Upside pressure persists amid technical breakout and overbought signals
TIA/USD recently broke above its MA-20 at $0.3309 and MA-50 at $0.3276, while remaining below the MA-200 at $0.4113. Immediate technical support is found at the Ichimoku Kijun level of $0.3331. On the hourly chart, momentum is strong with both MACD and ADX signaling Buy, and RSI at 65.38 also indicating positive momentum. However, Stoch RSI and CCI reflect overbought conditions, and BBP shows buyer dominance, supported by the Awesome Oscillator. The price sits close to daily highs, highlighting ongoing intraday volatility and solid upside pressure.
High upside probability as range-bound trading defines near-term action
Over the next trading day, TIA is expected to consolidate between $0.3469 and $0.3688, in line with typical volatility bands for the current environment. There is a high probability (79%) of continuation to the upside, while the odds of a downside reversal remain lower (21%). The baseline scenario involves range-bound trading within these levels, but a break above $0.3688 could trigger further gains, while a drop below $0.3331 would turn the focus to immediate risk lower.
Earlier, analysts noted that Celestia was experiencing a technical shift from sustained bearish momentum toward growing buyer dominance, signaling a potential change in market sentiment. The current setup not only reinforces this emerging bullish tone but also positions the $0.3688 level as a pivotal area, with a confirmed break potentially accelerating further gains beyond the established trading range.


Latest Celestia News


-
 Afghanistan
-
 Albania
-
 Algeria
-
 Angola
-
 Argentina
-
 Armenia
-
 Australia
-
 Austria
-
 Azerbaijan
-
 Bahamas
-
 Bahrain
-
 Bangladesh
-
 Belarus
-
 Belgium
-
 Bolivia
-
 Botswana
-
 Brazil
-
 Brunei
-
 Bulgaria
-
 Cambodia
-
 Cameroon
-
 Canada
-
 Chile
Chile
-
 China
China
-
 Colombia
-
 Congo
Congo
-
 Costa Rica
-
 Cote d'Ivoire
-
 Croatia
-
 Cuba
Cuba
-
 Cyprus
-
 Czechia
-
 DR Congo
-
 Denmark
-
 Dominican Republic
-
 Ecuador
-
 Egypt
Egypt
-
 El Salvador
-
 Estonia
-
 Eswatini
-
 Ethiopia
-
 Finland
-
 France
-
 Georgia
-
 Germany
-
 Ghana
Ghana
-
 Greece
-
 Haiti
Haiti
-
 Hong Kong
-
 Hungary
-
 India
India
-
 Indonesia
-
 Iran, Islamic republic
-
 Iraq
Iraq
-
 Ireland
-
 Israel
-
 Italy
Italy
-
 Jamaica
-
 Japan
Japan
-
 Jordan
-
 Kazakhstan
-
 Kenya
Kenya
-
 Korea
Korea
-
 Kuwait
-
 Kyrgyzstan
-
 Laos
Laos
-
 Latvia
-
 Lebanon
-
 Lesotho
-
 Libya
Libya
-
 Lithuania
-
 Luxembourg
-
 Madagascar
-
 Malaysia
-
 Malta
Malta
-
 Mauritius
-
 Mexico
-
 Moldova
-
 Mongolia
-
 Montenegro
-
 Morocco
-
 Mozambique
-
 Myanmar
-
 Namibia
-
 Nepal
Nepal
-
 Netherlands
-
 New Zealand
-
 Nigeria
-
 North Macedonia
-
 Norway
-
 Oman
Oman
-
 Pakistan
-
 Palestine
-
 Panama
-
 Papua New Guinea
-
 Paraguay
-
 Peru
Peru
-
 Philippines
-
 Poland
-
 Portugal
-
 Puerto Rico
-
 Qatar
Qatar
-
 Reunion
-
 Romania
-
 Rwanda
-
 Saudi Arabia
-
 Serbia
-
 Singapore
-
 Slovakia
-
 Slovenia
-
 Somalia
-
 South Africa
-
 Spain
Spain
-
 Sri Lanka
-
 Sweden
-
 Switzerland
-
 Syria
Syria
-
 Taiwan
-
 Tajikistan
-
 Tanzania
-
 Thailand
-
 Trinidad and Tobago
-
 Tunisia
-
 Turkey
-
 UAE
UAE
-
 Uganda
-
 Ukraine
-
 United Kingdom
-
United States
-
 Uruguay
-
 Uzbekistan
-
 Venezuela
-
 Vietnam
-
 Yemen
Yemen
-
 Zambia
-
 Zimbabwe
- Forex
- Crypto
