
Elevated volatility pushes Celestia up 5.44% in active session

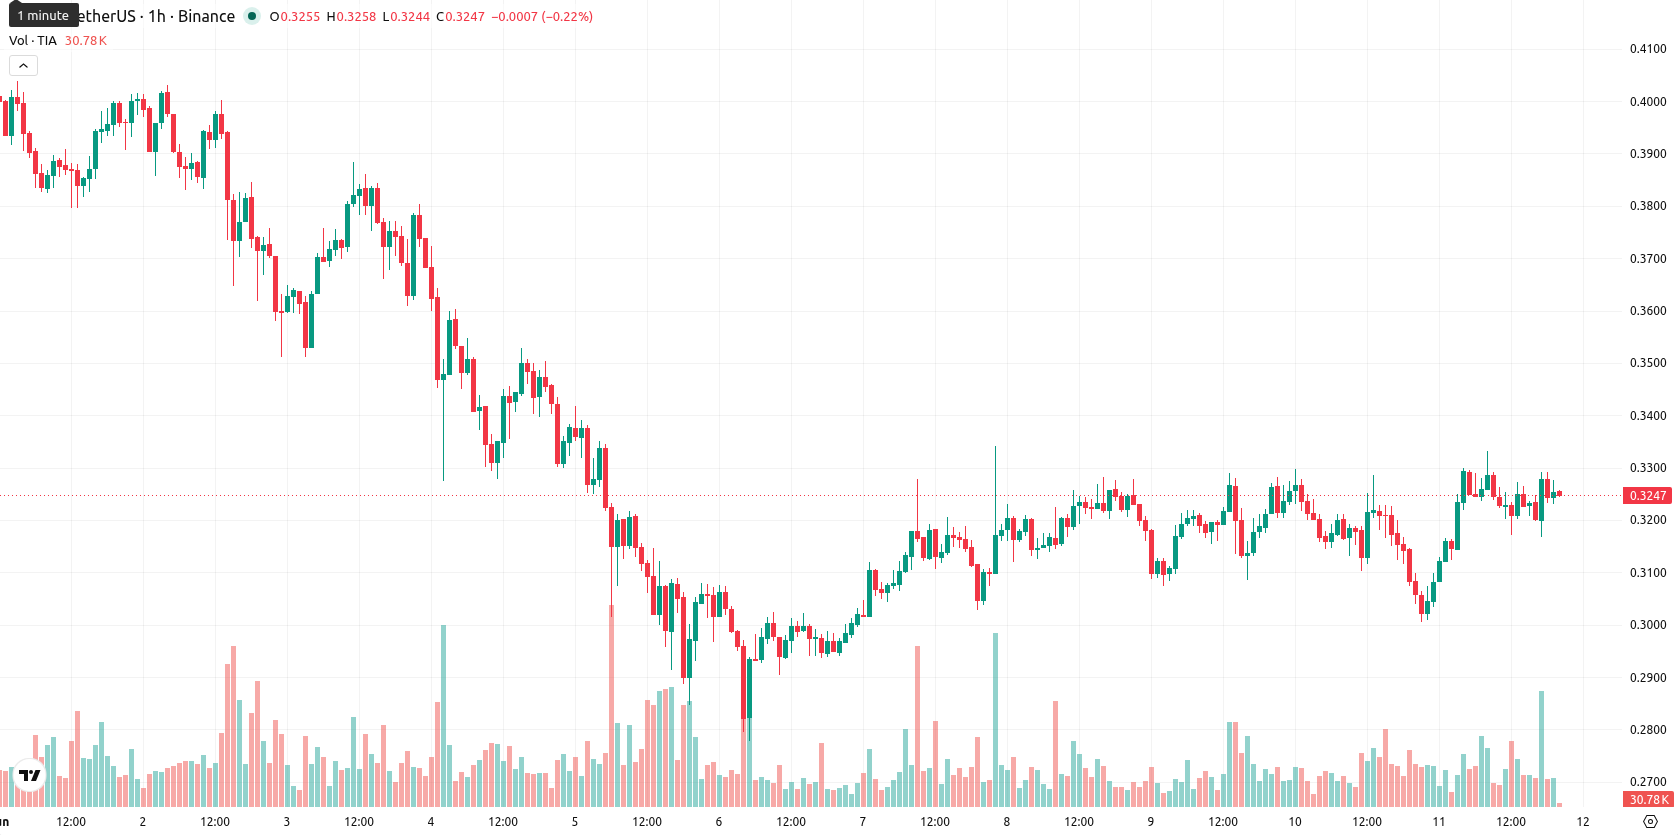
Celestia (TIA) is trading at $0.3258, up 5.44% on the day. The asset is currently positioned above its key moving averages, reflecting strong intraday and short-term momentum.
Highlights
- TIA/USD shows strong short-term bullish momentum, trading above key medium-term moving averages with intraday buyer dominance.
- Momentum and oscillator indicators signal a clear bullish bias, while trend strength remains neutral due to a weak ADX readout.
- Price is projected to consolidate between $0.2815 and $0.3401 over the next 1–3 sessions, with high probability of further gains unless support at $0.3168 fails.
Momentum signals mixed as price challenges moving average levels
On the H1 chart, TIA/USD has moved above the MA-20 ($0.3230) and MA-50 ($0.3197), while remaining below the MA-200 ($0.4144) on the daily timeframe. The Ichimoku Kijun at $0.3168 serves as immediate support. Among momentum indicators, MACD signals Buy and ADX holds Neutral. RSI registers 55.3, Stoch RSI and CCI both signal Buy, with BBP showing Strong Buy, highlighting buyer dominance; AO stands neutral, and intraday volatility is elevated.
Directional risks emerge amid projected price consolidation
Over the next 1–3 sessions, the price range is projected between $0.2815 and $0.3401, reflecting typical volatility around present levels. The baseline scenario suggests near-term consolidation within this band. A bullish scenario could see TIA USD surpass the upper resistance, sustaining new highs, while a bearish case would entail a drop below immediate support near the Kijun level and a potential move down toward the lower bound of the projected range.
Earlier, analysts noted that Celestia was exhibiting sustained bearish momentum and downside pressure. The latest shift in technical indicators toward buyer dominance indicates a potential change in market sentiment, highlighting the importance of monitoring whether upward momentum can be sustained above the Ichimoku Kijun support for confirmation of a bullish breakout.


Latest Celestia News


-
 Afghanistan
-
 Albania
-
 Algeria
-
 Angola
-
 Argentina
-
 Armenia
-
 Australia
-
 Austria
-
 Azerbaijan
-
 Bahamas
-
 Bahrain
-
 Bangladesh
-
 Belarus
-
 Belgium
-
 Bolivia
-
 Botswana
-
 Brazil
-
 Brunei
-
 Bulgaria
-
 Cambodia
-
 Cameroon
-
 Canada
-
 Chile
Chile
-
 China
China
-
 Colombia
-
 Congo
Congo
-
 Costa Rica
-
 Cote d'Ivoire
-
 Croatia
-
 Cuba
Cuba
-
 Cyprus
-
 Czechia
-
 DR Congo
-
 Denmark
-
 Dominican Republic
-
 Ecuador
-
 Egypt
Egypt
-
 El Salvador
-
 Estonia
-
 Eswatini
-
 Ethiopia
-
 Finland
-
 France
-
 Georgia
-
 Germany
-
 Ghana
Ghana
-
 Greece
-
 Haiti
Haiti
-
 Hong Kong
-
 Hungary
-
 India
India
-
 Indonesia
-
 Iran, Islamic republic
-
 Iraq
Iraq
-
 Ireland
-
 Israel
-
 Italy
Italy
-
 Jamaica
-
 Japan
Japan
-
 Jordan
-
 Kazakhstan
-
 Kenya
Kenya
-
 Korea
Korea
-
 Kuwait
-
 Kyrgyzstan
-
 Laos
Laos
-
 Latvia
-
 Lebanon
-
 Lesotho
-
 Libya
Libya
-
 Lithuania
-
 Luxembourg
-
 Madagascar
-
 Malaysia
-
 Malta
Malta
-
 Mauritius
-
 Mexico
-
 Moldova
-
 Mongolia
-
 Montenegro
-
 Morocco
-
 Mozambique
-
 Myanmar
-
 Namibia
-
 Nepal
Nepal
-
 Netherlands
-
 New Zealand
-
 Nigeria
-
 North Macedonia
-
 Norway
-
 Oman
Oman
-
 Pakistan
-
 Palestine
-
 Panama
-
 Papua New Guinea
-
 Paraguay
-
 Peru
Peru
-
 Philippines
-
 Poland
-
 Portugal
-
 Puerto Rico
-
 Qatar
Qatar
-
 Reunion
-
 Romania
-
 Rwanda
-
 Saudi Arabia
-
 Serbia
-
 Singapore
-
 Slovakia
-
 Slovenia
-
 Somalia
-
 South Africa
-
 Spain
Spain
-
 Sri Lanka
-
 Sweden
-
 Switzerland
-
 Syria
Syria
-
 Taiwan
-
 Tajikistan
-
 Tanzania
-
 Thailand
-
 Trinidad and Tobago
-
 Tunisia
-
 Turkey
-
 UAE
UAE
-
 Uganda
-
 Ukraine
-
 United Kingdom
-
United States
-
 Uruguay
-
 Uzbekistan
-
 Venezuela
-
 Vietnam
-
 Yemen
Yemen
-
 Zambia
-
 Zimbabwe
- Forex
- Crypto
