
Celestia falls 8.02% as sellers pressure the short-term trend

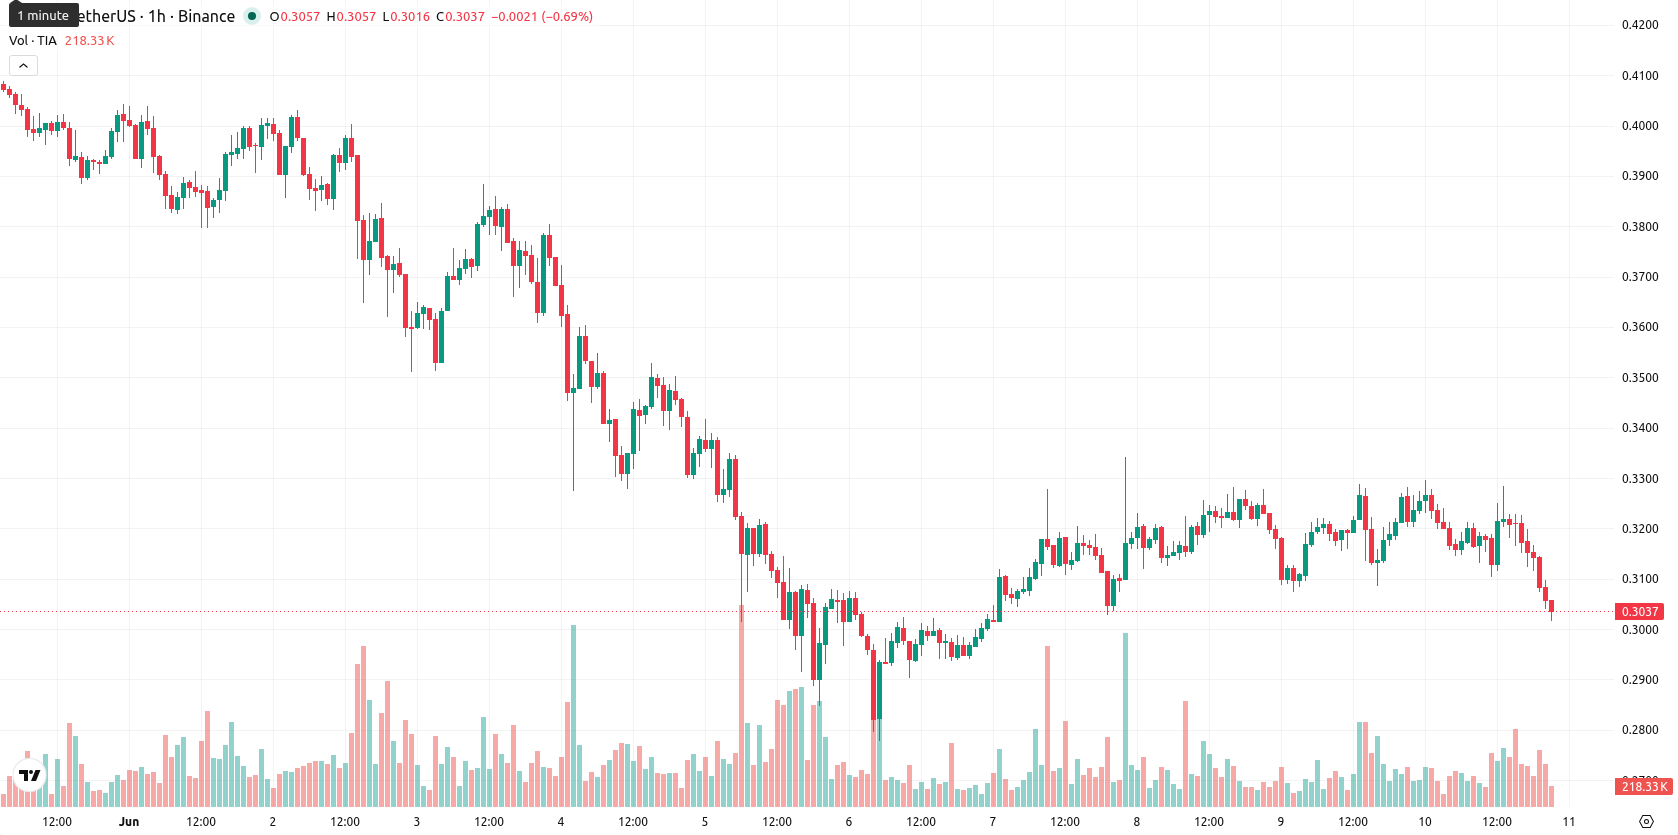
Celestia (TIA) is trading at $0.3016, marking a daily decline of 8.02%. The price remains below its key moving averages, reflecting notable short-term weakness.
Highlights
- TIA/USD trades below major moving averages, confirming sustained bearish pressure across short, medium, and long-term timeframes.
- Momentum and volume indicators remain decisively bearish, but multiple oversold signals reflect seller exhaustion and short-term volatility.
- The forecast range is $0.2804 to $0.3228 over the next 2–3 days, with a much higher probability of further downside than reversal.
Bearish momentum persists as technical barriers reinforce volatility
On the hourly chart, TIA/USD is positioned below the MA-20 ($0.3175), MA-50 ($0.3186), and the long-term MA-200 ($0.4160), reinforcing immediate resistance near the Ichimoku Kijun at $0.3182. Momentum indicators show a bearish setup, with both MACD and Awesome Oscillator signaling "Sell" and ADX reflecting a neutral trend. Oscillators including RSI, CCI, and Stoch RSI all point to oversold conditions, highlighting short-term downside exhaustion. BBP remains on "Sell", confirming intraday seller dominance while price action hovers near session lows with considerable volatility.
Low upside prospects as price seen consolidating within range
Over the next 2–3 trading days, the expected price range for TIA is $0.2804 to $0.3228, reflecting the current volatility band. The probability of a significant upward move is very low under prevailing conditions. Baseline expectations are for price to consolidate within this corridor, with a bullish scenario requiring a break above the Kijun resistance at $0.3182, while a failure of support at the lower end could trigger additional downside.
Previously it was reported that Celestia was experiencing sustained bearish momentum amid prevailing downside pressure. The current analysis reinforces this view with fresh evidence of intraday weakness and elevated volatility, suggesting traders should closely monitor the critical support near the lower boundary of the expected range for signs of further downside risk.


-
 Afghanistan
-
 Albania
-
 Algeria
-
 Angola
-
 Argentina
-
 Armenia
-
 Australia
-
 Austria
-
 Azerbaijan
-
 Bahamas
-
 Bahrain
-
 Bangladesh
-
 Belarus
-
 Belgium
-
 Bolivia
-
 Botswana
-
 Brazil
-
 Brunei
-
 Bulgaria
-
 Cambodia
-
 Cameroon
-
 Canada
-
 Chile
Chile
-
 China
China
-
 Colombia
-
 Congo
Congo
-
 Costa Rica
-
 Cote d'Ivoire
-
 Croatia
-
 Cuba
Cuba
-
 Cyprus
-
 Czechia
-
 DR Congo
-
 Denmark
-
 Dominican Republic
-
 Ecuador
-
 Egypt
Egypt
-
 El Salvador
-
 Estonia
-
 Eswatini
-
 Ethiopia
-
 Finland
-
 France
-
 Georgia
-
 Germany
-
 Ghana
Ghana
-
 Greece
-
 Haiti
Haiti
-
 Hong Kong
-
 Hungary
-
 India
India
-
 Indonesia
-
 Iran, Islamic republic
-
 Iraq
Iraq
-
 Ireland
-
 Israel
-
 Italy
Italy
-
 Jamaica
-
 Japan
Japan
-
 Jordan
-
 Kazakhstan
-
 Kenya
Kenya
-
 Korea
Korea
-
 Kuwait
-
 Kyrgyzstan
-
 Laos
Laos
-
 Latvia
-
 Lebanon
-
 Lesotho
-
 Libya
Libya
-
 Lithuania
-
 Luxembourg
-
 Madagascar
-
 Malaysia
-
 Malta
Malta
-
 Mauritius
-
 Mexico
-
 Moldova
-
 Mongolia
-
 Montenegro
-
 Morocco
-
 Mozambique
-
 Myanmar
-
 Namibia
-
 Nepal
Nepal
-
 Netherlands
-
 New Zealand
-
 Nigeria
-
 North Macedonia
-
 Norway
-
 Oman
Oman
-
 Pakistan
-
 Palestine
-
 Panama
-
 Papua New Guinea
-
 Paraguay
-
 Peru
Peru
-
 Philippines
-
 Poland
-
 Portugal
-
 Puerto Rico
-
 Qatar
Qatar
-
 Reunion
-
 Romania
-
 Rwanda
-
 Saudi Arabia
-
 Serbia
-
 Singapore
-
 Slovakia
-
 Slovenia
-
 Somalia
-
 South Africa
-
 Spain
Spain
-
 Sri Lanka
-
 Sweden
-
 Switzerland
-
 Syria
Syria
-
 Taiwan
-
 Tajikistan
-
 Tanzania
-
 Thailand
-
 Trinidad and Tobago
-
 Tunisia
-
 Turkey
-
 UAE
UAE
-
 Uganda
-
 Ukraine
-
 United Kingdom
-
United States
-
 Uruguay
-
 Uzbekistan
-
 Venezuela
-
 Vietnam
-
 Yemen
Yemen
-
 Zambia
-
 Zimbabwe
- Forex
- Crypto
