
-7.06% for Celestia as network adoption remains limited

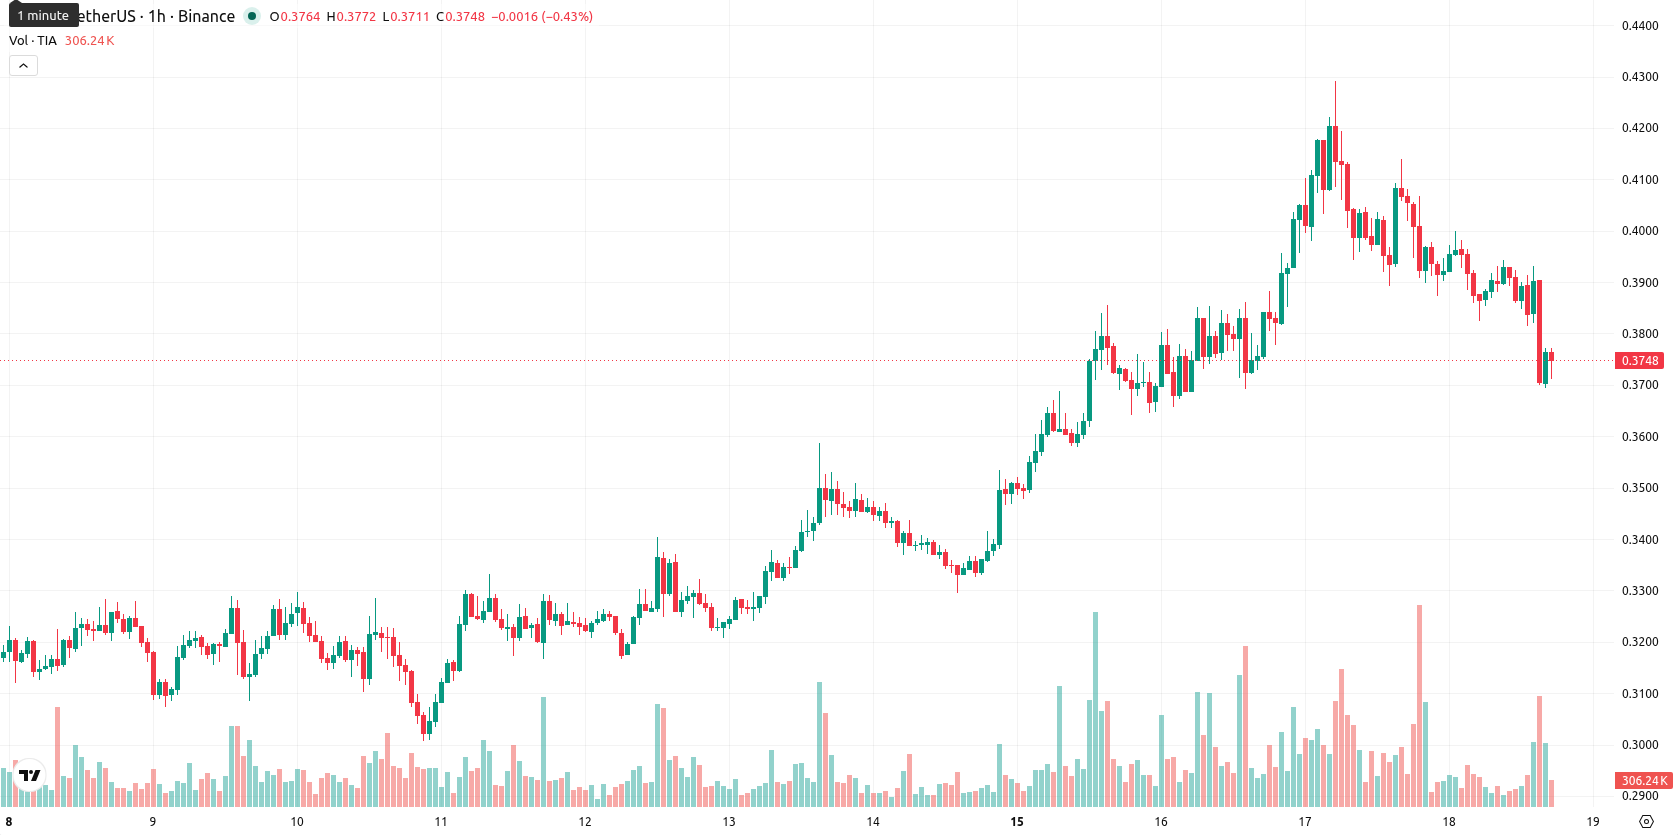
Celestia (TIA) is trading at $0.3753, having declined 7.06% intraday. The asset remains below its key moving averages, indicating ongoing downward momentum.
Highlights
- Ongoing token unlocks continue to increase Celestia's circulating supply, intensifying near-term sell-side pressure on the asset.
- Sector rotation toward AI and real world assets has diverted investor interest from Celestia, amplifying concerns over limited user adoption and growth.
- Technical indicators confirm a strong bearish trend for TIA/USD, with price projected to range between $0.3501 and $0.4005 amid high volatility and low reversal probability.
Token unlocks add supply pressure as investors rotate to AI plays
Recent trading for Celestia has been marked by steady token unlocks, which have added to the circulating supply and increased potential sell-side pressure on the asset. The overall market environment has seen a broader narrative shift toward AI and Real World Assets, leading to diminished investor focus on projects like Celestia. In addition, reports of limited sustainable adoption highlight constraints on user growth and overall network activity, compounding challenges for the asset amid ongoing sector rotation.
Bearish momentum persists as multiple technical barriers hold firm
On the technical side, TIA is trading below the MA-20 ($0.3889) and MA-50 ($0.3952) on the hourly chart, with the longer-term MA-200 ($0.4049) on the daily timeframe also acting as resistance. The Ichimoku Kijun level at $0.3922 presents immediate resistance overhead. Momentum indicators remain negative: the MACD signals Sell, the ADX is Neutral, and the RSI at 37.76 indicates further selling pressure. The CCI suggests an oversold condition and Stoch RSI is Neutral, reflecting persistent bearish momentum with some short-term oversold readings. Bull/Bear Power points to seller dominance intraday, while the Awesome Oscillator confirms the downward trend.
Downside risk elevated as volatility band limits rebound potential
Over the next two to three trading days, TIA is expected to trade within a typical volatility band of $0.3501 to $0.4005. The probability of an upside move is low, while further downside risk remains elevated. The baseline scenario is for continued sideways movement within this corridor. A bullish reversal would require a sustained break above $0.3922 and the upper end of the trading range; a breakdown below $0.3501 could expose the asset to additional losses.
Earlier, analysts noted that Celestia was exhibiting strong bullish momentum, albeit with warning signs of potential short-term consolidation due to mixed technical signals. Recent developments signal a notable shift to sustained downside pressure, making the trajectory around the $0.3922 resistance a critical level to watch for any early signs of recovery.


-
 Afghanistan
-
 Albania
-
 Algeria
-
 Angola
-
 Argentina
-
 Armenia
-
 Australia
-
 Austria
-
 Azerbaijan
-
 Bahamas
-
 Bahrain
-
 Bangladesh
-
 Belarus
-
 Belgium
-
 Bolivia
-
 Botswana
-
 Brazil
-
 Brunei
-
 Bulgaria
-
 Cambodia
-
 Cameroon
-
 Canada
-
 Chile
Chile
-
 China
China
-
 Colombia
-
 Congo
Congo
-
 Costa Rica
-
 Cote d'Ivoire
-
 Croatia
-
 Cuba
Cuba
-
 Cyprus
-
 Czechia
-
 DR Congo
-
 Denmark
-
 Dominican Republic
-
 Ecuador
-
 Egypt
Egypt
-
 El Salvador
-
 Estonia
-
 Eswatini
-
 Ethiopia
-
 Finland
-
 France
-
 Georgia
-
 Germany
-
 Ghana
Ghana
-
 Greece
-
 Haiti
Haiti
-
 Hong Kong
-
 Hungary
-
 India
India
-
 Indonesia
-
 Iran, Islamic republic
-
 Iraq
Iraq
-
 Ireland
-
 Israel
-
 Italy
Italy
-
 Jamaica
-
 Japan
Japan
-
 Jordan
-
 Kazakhstan
-
 Kenya
Kenya
-
 Korea
Korea
-
 Kuwait
-
 Kyrgyzstan
-
 Laos
Laos
-
 Latvia
-
 Lebanon
-
 Lesotho
-
 Libya
Libya
-
 Lithuania
-
 Luxembourg
-
 Madagascar
-
 Malaysia
-
 Malta
Malta
-
 Mauritius
-
 Mexico
-
 Moldova
-
 Mongolia
-
 Montenegro
-
 Morocco
-
 Mozambique
-
 Myanmar
-
 Namibia
-
 Nepal
Nepal
-
 Netherlands
-
 New Zealand
-
 Nigeria
-
 North Macedonia
-
 Norway
-
 Oman
Oman
-
 Pakistan
-
 Palestine
-
 Panama
-
 Papua New Guinea
-
 Paraguay
-
 Peru
Peru
-
 Philippines
-
 Poland
-
 Portugal
-
 Puerto Rico
-
 Qatar
Qatar
-
 Reunion
-
 Romania
-
 Rwanda
-
 Saudi Arabia
-
 Serbia
-
 Singapore
-
 Slovakia
-
 Slovenia
-
 Somalia
-
 South Africa
-
 Spain
Spain
-
 Sri Lanka
-
 Sweden
-
 Switzerland
-
 Syria
Syria
-
 Taiwan
-
 Tajikistan
-
 Tanzania
-
 Thailand
-
 Trinidad and Tobago
-
 Tunisia
-
 Turkey
-
 UAE
UAE
-
 Uganda
-
 Ukraine
-
 United Kingdom
-
United States
-
 Uruguay
-
 Uzbekistan
-
 Venezuela
-
 Vietnam
-
 Yemen
Yemen
-
 Zambia
-
 Zimbabwe
- Forex
- Crypto
