
Cosmos slides toward support with no bullish divergence in sight: weekly analysis

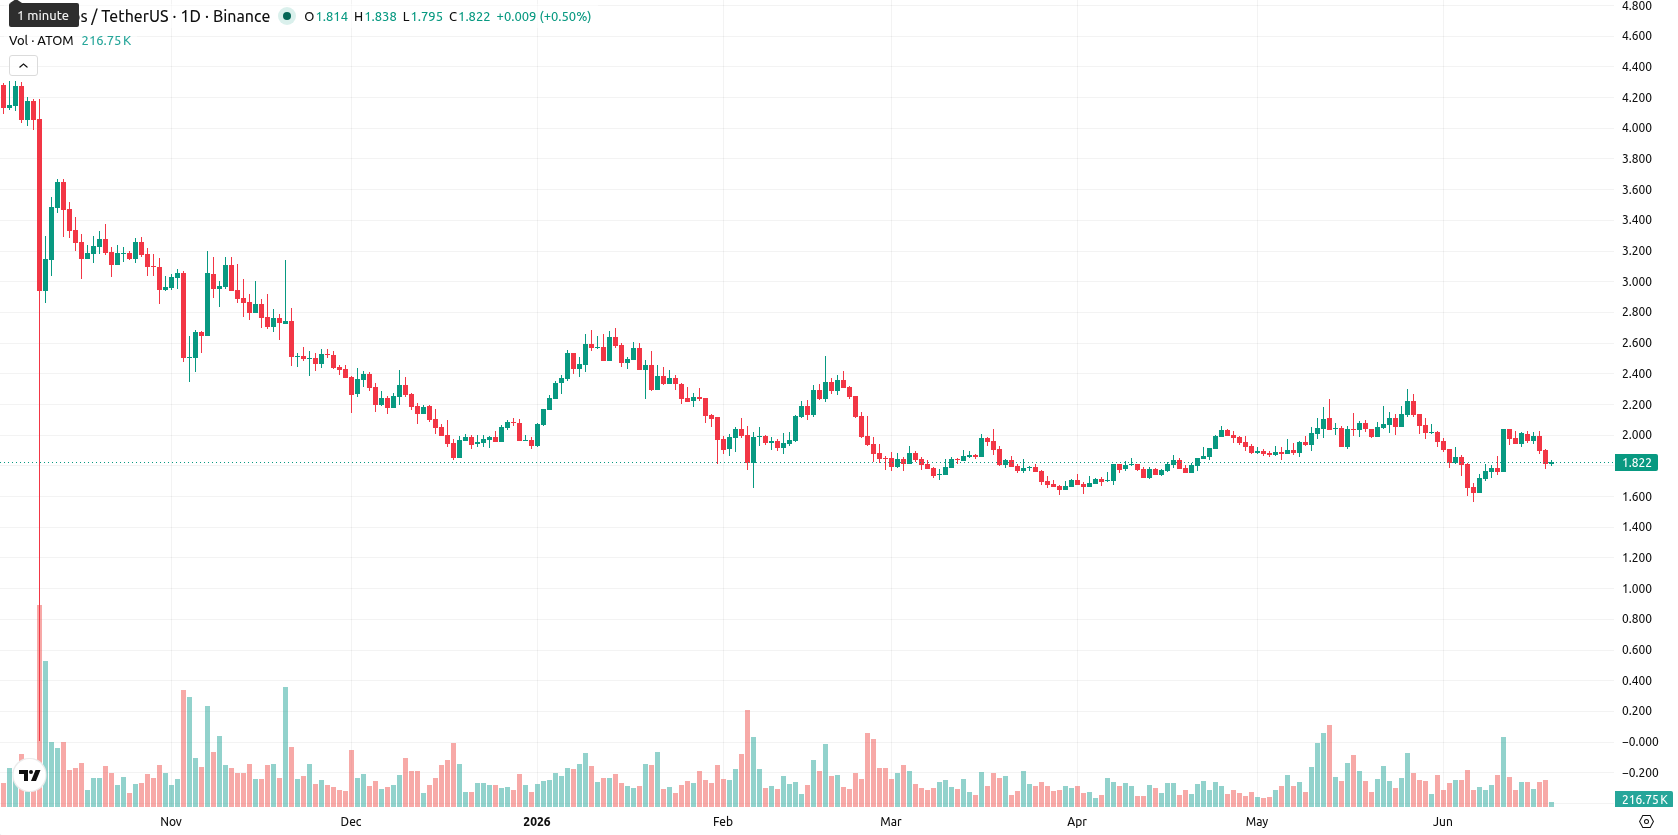
Cosmos (ATOM) has experienced persistent selling over the last week, falling $0.166 (8.35%) and closing at the lower end of its seven-day range. The asset remains well below its weekly MA-20 ($1.8896), MA-50 ($2.8119), and MA-200 ($7.0464) levels, reinforcing a bearish outlook on the medium- and long-term charts.
Highlights
- ATOM remains under strong bearish pressure, with price trading below key moving averages and showing no signs of reversal.
- Momentum indicators such as MACD, ADX, RSI, and others all confirm sellers are in control and downside persists.
- Baseline scenario favors sideways movement in the $1.75 to $1.89 range with any upside break above $1.89 unlikely and further losses likely if $1.75 support fails.
Bearish momentum extended this week as indicators show no reversal
ATOM continues to trade below its key weekly moving averages, with the MA-20 ($1.8896) as the nearest dynamic resistance and the MA-50 ($2.8119) and MA-200 ($7.0464) reinforcing the broader downtrend. Weekly chart indicators remain firmly bearish: the MACD and ADX show strong downward momentum, Bull/Bear Power favors sellers, and the Awesome Oscillator holds a neutral stance but does not contradict the negative bias. RSI and Stochastic RSI are positioned in neutral to sell territory with no oversold bounce, while CCI also leans lower. With volatility at 13.77%, price remains anchored at support, lacking any bullish divergence.
Sideways bias and downside risk expected in coming week amid weak signals
Based on the weekly technical picture, the expected trading range for ATOM over the next 7 days is $1.75 to $1.89. There is a low probability of a significant upward move, as none of the four primary weekly indicators suggests a buying opportunity. The baseline scenario points to sideways price action as the market consolidates near support. Only a sustained break above $1.89 would signal a possible shift toward recovery, while a close below $1.75 could open the door for further losses.
Earlier, analysts noted that Cosmos was facing persistent bearish momentum amid operational stagnation and diminished network demand. The continuation of these trends on the weekly timeframe reinforces the prevailing downside scenario, making a sustained breakdown below $1.75 a key risk to monitor in the upcoming sessions.


-
 Afghanistan
-
 Albania
-
 Algeria
-
 Angola
-
 Argentina
-
 Armenia
-
 Australia
-
 Austria
-
 Azerbaijan
-
 Bahamas
-
 Bahrain
-
 Bangladesh
-
 Belarus
-
 Belgium
-
 Bolivia
-
 Botswana
-
 Brazil
-
 Brunei
-
 Bulgaria
-
 Cambodia
-
 Cameroon
-
 Canada
-
 Chile
Chile
-
 China
China
-
 Colombia
-
 Congo
Congo
-
 Costa Rica
-
 Cote d'Ivoire
-
 Croatia
-
 Cuba
Cuba
-
 Cyprus
-
 Czechia
-
 DR Congo
-
 Denmark
-
 Dominican Republic
-
 Ecuador
-
 Egypt
Egypt
-
 El Salvador
-
 Estonia
-
 Eswatini
-
 Ethiopia
-
 Finland
-
 France
-
 Georgia
-
 Germany
-
 Ghana
Ghana
-
 Greece
-
 Haiti
Haiti
-
 Hong Kong
-
 Hungary
-
 India
India
-
 Indonesia
-
 Iran, Islamic republic
-
 Iraq
Iraq
-
 Ireland
-
 Israel
-
 Italy
Italy
-
 Jamaica
-
 Japan
Japan
-
 Jordan
-
 Kazakhstan
-
 Kenya
Kenya
-
 Korea
Korea
-
 Kuwait
-
 Kyrgyzstan
-
 Laos
Laos
-
 Latvia
-
 Lebanon
-
 Lesotho
-
 Libya
Libya
-
 Lithuania
-
 Luxembourg
-
 Madagascar
-
 Malaysia
-
 Malta
Malta
-
 Mauritius
-
 Mexico
-
 Moldova
-
 Mongolia
-
 Montenegro
-
 Morocco
-
 Mozambique
-
 Myanmar
-
 Namibia
-
 Nepal
Nepal
-
 Netherlands
-
 New Zealand
-
 Nigeria
-
 North Macedonia
-
 Norway
-
 Oman
Oman
-
 Pakistan
-
 Palestine
-
 Panama
-
 Papua New Guinea
-
 Paraguay
-
 Peru
Peru
-
 Philippines
-
 Poland
-
 Portugal
-
 Puerto Rico
-
 Qatar
Qatar
-
 Reunion
-
 Romania
-
 Rwanda
-
 Saudi Arabia
-
 Serbia
-
 Singapore
-
 Slovakia
-
 Slovenia
-
 Somalia
-
 South Africa
-
 Spain
Spain
-
 Sri Lanka
-
 Sweden
-
 Switzerland
-
 Syria
Syria
-
 Taiwan
-
 Tajikistan
-
 Tanzania
-
 Thailand
-
 Trinidad and Tobago
-
 Tunisia
-
 Turkey
-
 UAE
UAE
-
 Uganda
-
 Ukraine
-
 United Kingdom
-
United States
-
 Uruguay
-
 Uzbekistan
-
 Venezuela
-
 Vietnam
-
 Yemen
Yemen
-
 Zambia
-
 Zimbabwe
- Forex
- Crypto
