
-8.11% for Cosmos as dYdX migration impacts network utility

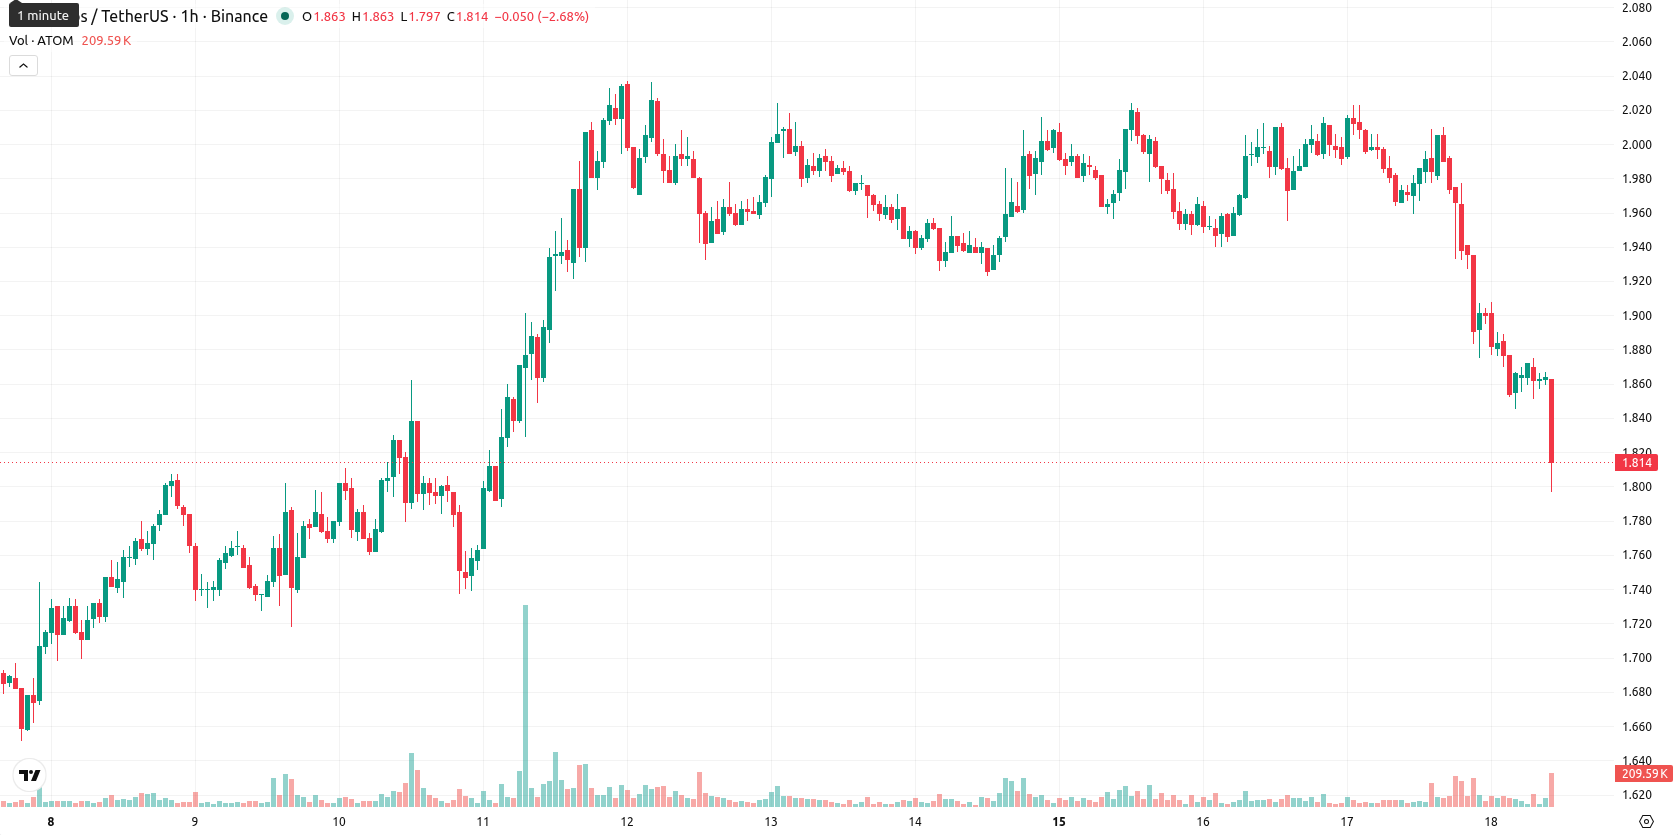
Cosmos (ATOM) is trading at $1.812, down 8.11% on the session and remaining near the day's lows. The asset currently sits below its key moving averages, reflecting sustained intraday selling momentum.
Highlights
- Operational stagnation on Cosmos Hub and the departure of high-profile projects have reduced new demand drivers for ATOM.
- ATOM's primary roles remain in network staking and transaction fees, but limited ecosystem growth is constraining underlying demand.
- ATOM/USD faces strong selling momentum, trading below key averages, with a high probability of dropping below $1.7757757 in the near term.
Diminished ecosystem expansion as demand weakens after project departures
Recent operational stagnation on the Cosmos Hub has limited new demand drivers for ATOM, as the absence of high-profile project launches has reduced both network activity and fundamental interest. According to the provided background, applications such as dYdX migrating away from Cosmos' shared security framework further diminish ATOM's utility and impact its relevance for securing partner chains. Ongoing use cases for ATOM—such as covering transaction fees and network staking—continue to offer a functional role in network operations, but the lack of ecosystem expansion and application retention weighs on underlying demand.
Persistent selling pressure as major resistance and sell signals converge
ATOM/USD currently trades below the 20-day ($1.9087000), 50-day ($1.9589600), and 200-day ($2.0124750) moving averages. Immediate resistance is defined by the Ichimoku Kijun at $1.9275000. On the momentum side, both MACD and ADX indicate notable selling strength, while RSI and CCI readings remain firmly in sell territory. Stoch RSI is neutral, and Bull/Bear Power (BBP) also points to continued selling pressure. The Awesome Oscillator does not provide additional confirmation of the trend.
Downside risks intensify as low upside odds persist
Over the next two to three trading days, price action is expected to fall within the $1.7757757 to $2.0310000 range, reflecting typical volatility for ATOM under current market conditions. The probability of an upward move is very low, while a downward scenario prevails. If price holds within this range, it would constitute the baseline scenario, while a break above $1.9275000 resistance could lead to bullish momentum. A move below the $1.7757757 support level would signal further downside risk.
In a recent review, analysts noted that Cosmos continued to exhibit persistent bearish momentum and elevated volatility, with traders closely monitoring technical resistance as a potential catalyst for renewed strength. Current developments reinforce this outlook, as operational stagnation and diminished project activity further validate a downside scenario, making sustained closes below $1.7757757 a crucial signal for potential continuation of the bearish trend.


-
 Afghanistan
-
 Albania
-
 Algeria
-
 Angola
-
 Argentina
-
 Armenia
-
 Australia
-
 Austria
-
 Azerbaijan
-
 Bahamas
-
 Bahrain
-
 Bangladesh
-
 Belarus
-
 Belgium
-
 Bolivia
-
 Botswana
-
 Brazil
-
 Brunei
-
 Bulgaria
-
 Cambodia
-
 Cameroon
-
 Canada
-
 Chile
Chile
-
 China
China
-
 Colombia
-
 Congo
Congo
-
 Costa Rica
-
 Cote d'Ivoire
-
 Croatia
-
 Cuba
Cuba
-
 Cyprus
-
 Czechia
-
 DR Congo
-
 Denmark
-
 Dominican Republic
-
 Ecuador
-
 Egypt
Egypt
-
 El Salvador
-
 Estonia
-
 Eswatini
-
 Ethiopia
-
 Finland
-
 France
-
 Georgia
-
 Germany
-
 Ghana
Ghana
-
 Greece
-
 Haiti
Haiti
-
 Hong Kong
-
 Hungary
-
 India
India
-
 Indonesia
-
 Iran, Islamic republic
-
 Iraq
Iraq
-
 Ireland
-
 Israel
-
 Italy
Italy
-
 Jamaica
-
 Japan
Japan
-
 Jordan
-
 Kazakhstan
-
 Kenya
Kenya
-
 Korea
Korea
-
 Kuwait
-
 Kyrgyzstan
-
 Laos
Laos
-
 Latvia
-
 Lebanon
-
 Lesotho
-
 Libya
Libya
-
 Lithuania
-
 Luxembourg
-
 Madagascar
-
 Malaysia
-
 Malta
Malta
-
 Mauritius
-
 Mexico
-
 Moldova
-
 Mongolia
-
 Montenegro
-
 Morocco
-
 Mozambique
-
 Myanmar
-
 Namibia
-
 Nepal
Nepal
-
 Netherlands
-
 New Zealand
-
 Nigeria
-
 North Macedonia
-
 Norway
-
 Oman
Oman
-
 Pakistan
-
 Palestine
-
 Panama
-
 Papua New Guinea
-
 Paraguay
-
 Peru
Peru
-
 Philippines
-
 Poland
-
 Portugal
-
 Puerto Rico
-
 Qatar
Qatar
-
 Reunion
-
 Romania
-
 Rwanda
-
 Saudi Arabia
-
 Serbia
-
 Singapore
-
 Slovakia
-
 Slovenia
-
 Somalia
-
 South Africa
-
 Spain
Spain
-
 Sri Lanka
-
 Sweden
-
 Switzerland
-
 Syria
Syria
-
 Taiwan
-
 Tajikistan
-
 Tanzania
-
 Thailand
-
 Trinidad and Tobago
-
 Tunisia
-
 Turkey
-
 UAE
UAE
-
 Uganda
-
 Ukraine
-
 United Kingdom
-
United States
-
 Uruguay
-
 Uzbekistan
-
 Venezuela
-
 Vietnam
-
 Yemen
Yemen
-
 Zambia
-
 Zimbabwe
- Forex
- Crypto
